Review of Paper Machines, produced by Chris Johnson-Roberson and Jo Guldi
Adam Crymble
Paper Machines Version: 0.3.6
Requirements: Zotero, Python 2.7.3, Java.
Reviewed: 25 February 2013
Tested on: Mac OS X v. 10.6.8, and Windows 7
Tested with Zotero for Firefox 3.0 and Zotero Standalone 3.0
Paper Machines is an interactive multi-tool that allows users to perform textual analyses on their Zotero notes, tags, HTML snapshots, or attached pdfs (if OCR layer is present) directly in Zotero. The project provides users with an effective way to get an intellectual grasp of a corpus relatively quickly. This Zotero add-on currently ships with five different tools, which make it possible to determine anything from the topics found in a user’s Zotero library to the geographic distribution of the references present. The project works in both Zotero’s Firefox and standalone versions, which makes it particularly convenient for Zotero users but considerably less appealing for anyone who stores their research material in another program or format. Paper Machines is a promising and visually appealing teaching tool that would be particularly useful for introducing students to topic modeling, but needs some improvements to the code and documentation to be world class.
The venture is still in its alpha-phase, which means we should be both forgiving of faults, but also wary of its unpolished nature. Developed by Chris Johnson-Roberson under the direction of Jo Guldi and Matthew Battles at the metaLab@Harvard, this project is forward thinking, providing access to a number of open source textual analysis projects, including MALLET for topic modeling and a geoparser by Pete Warden, through a single interface. As Paper Machines is built to use already existing tools, it does not provide any new abilities to textual scholars. However, users will find appealing Paper Machines’ ability to generate different types of visualizations very quickly. As the tool does not currently make it easy to export raw data or validate the analyses conducted, users would be wise not to risk their academic reputations on the tool’s outputs unless verified through more verbose and transparent tools. This project’s great contribution is probably not to research, but to pedagogy and skills training.
The greatest value of Paper Machines is that it provides an engaging and visually stunning introduction to textual analysis for students and others looking to get their toes wet with topic modeling or linked data. This allows anyone to begin exploring large collections of sources to look for trends in the data such as an increasing interest in certain subjects over time, which could point the researcher to interesting questions worth pursuing further.
With Paper Machines, anyone with a collection of texts stored in Zotero can generate word clouds, phrase nets, map geo-references found in their corpus, extract structured data using DBPedia, or generate and visualize topic models. All of this can be done without having to pre-process your corpus or leave Zotero. For readers wondering if Paper Machines is right for their needs, the Library at Emory has conducted an excellent comparative case study of Paper Machines, Voyant, MALLET, and Viewshare. That succinct comparison showcases the strengths and weaknesses of each project, and suggests the best tool depends on what you are trying to determine about your corpus
Of Paper Machines’ features, the word cloud tool is probably the most disappointing. The resultant image, which can be seen in Figure 1, is considerably less flexible and attractive than those generated by other projects such as Voyant or Wordle — though for those with a corpus in Zotero it is considerably quicker to use the Paper Machines version than it is to extract all of the text from Zotero and send it to one of the competing tools. The value of word clouds is certainly debatable, but could be useful for identifying obvious keywords. From looking at Figure 1 you might assume the corpus had something to do with Irish and English authors. It turns out that is not quite correct, but it is not far off either.
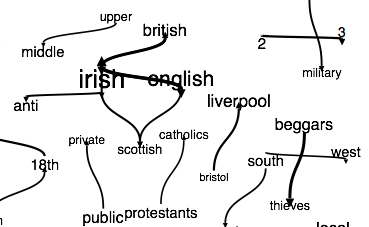
Phrase nets, built on the IBM Many Eyes tool of the same name, offers users the option of looking for word patterns in the corpus. For example a phrase net generated by ‘x and y’ will return a visualization of the key terms connected by the conjunction ‘and’. As can be seen in Figure 2, which shows a phrase net, these relationships are displayed through a series of keyword pairs connected by an arrow. If a user was interested in colocation then this tool may prove useful. For example, a phrase net of ‘x as y’ may be a useful way to extract similes in a series of poems for further consideration. Using Paper Machines it is possible to create phrase nets of any pattern using regular expressions, which is convenient for advanced users. Despite this flexibility, the image output has limited controls. It is possible to drag overlapping phrases to make them easier to see, but the image itself is small, meaning it can be quite crowded. Users interested in the data behind the visualization will be disappointed not to have access to it.
The tool’s mapping feature promises to allow users the ability to map their Zotero corpus through a series of placename gazetteers. This includes the option to heatmap a map of the world highlighting the areas mentioned most in the corpus, and to generate ‘flight paths’ or lines between a work’s place of publication and places mentioned in the text. Unfortunately neither mapping feature functioned properly during this review and produced no matches, despite obvious place names shown in Figure 2 above.
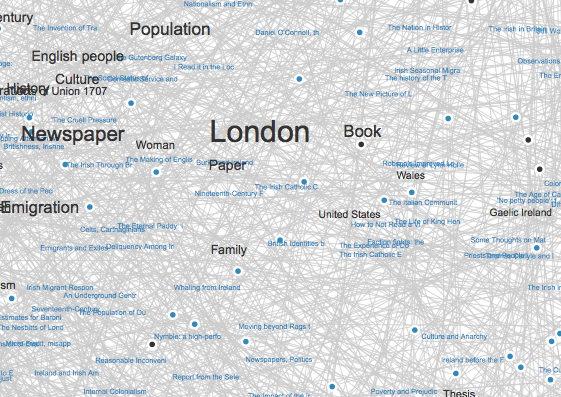
DBPedia annotation uses the DBpedia Spotlight service to identify relationships between ‘named entities’ in the corpus. Clicking on a black word opens a tab containing encyclopedic information on the term. On a small corpus the connections between entities might provide interesting information about people and places in a user’s corpus. On a larger corpus the connections are less useful as can be seen from the tangle of grey lines in Figure 3. This feature is memory intensive and may cause Firefox to crash if the corpus is too large.
The flagship feature is undoubtedly the topic modeling visualization feature, which has generated the most excitement towards the project. The topic models themselves are built using MALLET, and the tool promises an easier way to interpret the results than does MALLET through an attractive visualization. The program makes it easy to control a number of MALLET variables used when generating the topics. These controls range from the ability to choose the number of topics to the option of selecting the number of iterations the algorithm runs. For new users these options can comfortably be ignored.
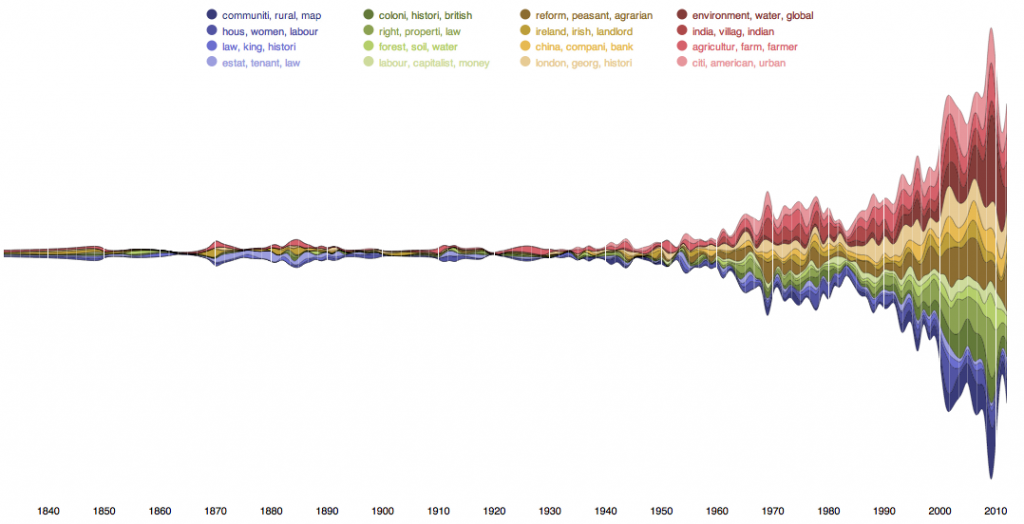
The resultant stream graph, which can be seen in Figure 4, is undoubtedly stunning, and certainly is easier to interpret quickly than MALLET’s numerical outputs. Someone with a large corpus of newspaper articles may find this tool useful for mapping a rising interest in a given topic over time: perhaps China or Afghanistan. However, the graph emphasizes style over substance in a manner this reviewer would call ‘shock and awe’, designed to overwhelm a reader instead of focusing on a clear mode of conveying the data.
As Andy Kirk noted in 2010, the data visualization community continues to be divided about the value of stream graphs, as both sides argue over their readability. Over time, these graphs will probably become commonplace as they are incorporated more readily into familiar visualization tools such as Microsoft Excel, their novelty is likely to wane and the project will instead have to stand on its own merits. The graph itself lacks a labeled y-axis, making it impossible to tell exactly what one is looking at or what units are being displayed. There are mysterious faded sections on the x-axis, which suggest gaps in the data, but nowhere is this made explicit. This is even more obvious when using your own corpus rather than the one optimized to give pretty results seen below. It is also not clear if it is possible to get a copy of MALLET’s output which was used to create the graph in case the user wanted to conduct his or her own analysis.

Figure 4: Example output of Paper Machines Topic Modeling Stream Graph created by Chris Johnson-Roberson (Creative Commons Attribute 3.0 Unported)
As an alpha-release, the project does have some outstanding deficiencies. In general the project is under-documented, which is a serious problem considering the greatest potential of Paper Machines is as a gentle but engaging introduction to textual analysis. There is no thorough tutorial available to explain the features and assist new users to interpret the visualizations. If the user has never installed a Firefox add-on before it is not clear how to do so from the limited instructions available in the ‘read me’ file. The project also contains a number of bugs, which are particularly evident for Mac users. I have been unable to use the mapping tools, and have seen many error messages when trying the various features. It also took nearly six hours to get the tool installed because of a conflict with Python versions on my machine that is well beyond a novice user’s ability to resolve. Though I know that is not a typical experience installing the add-on, I imagine others also experienced similar problems and were not as persistent at solving them.
With some user testing on different machines, increased documentation, and greater transparency of inputs and outputs, Paper Machines could quickly become the industry standard for introducing topic modeling to students — though this project can never replace a true understanding of the strengths and limits of topic modeling. Another few months of work or some more collaborators who are committed to polishing the project could make a real difference to an already great initiative and I for one hope the team keeps moving forward.


