Review of Mapping Texts
Robert Nelson
Mapping Texts addresses a pressing problem and an exciting opportunity that many working in digital humanities are tackling: now that we have massive amounts of historical evidence digitized, what new questions can we pose and what new knowledge can we produce? Developed though a collaboration of two teams at the University of North Texas and Stanford University — the former led by Andrew Torget and including Mark Phillips, Rada Mihalcea, and Eliza Tze-I Yang; the latter led by Jon Christensen and including Cameron Blevins, Rio Akasaka, Geoff McGhee, Yinfeng Qin, and Jason Ninxuan Wang — the project seeks, to quote their white paper, “to help scholars develop new tools for coping effectively with the growing challenge of doing research in the age of abundance” by marrying two common methods: text mining and geovisualization.
As the creators of Mapping Texts note, these two methods are typically used independently of one another to uncover patterns in and make sense of massive amounts of digitized evidence. In Mapping Texts these methods are combined in two provocative visualization tools that aim to explore a very large corpus: nearly a quarter of a million pages from 100 Texas newspapers from the Chronicling America project dating from 1829 to 2008.
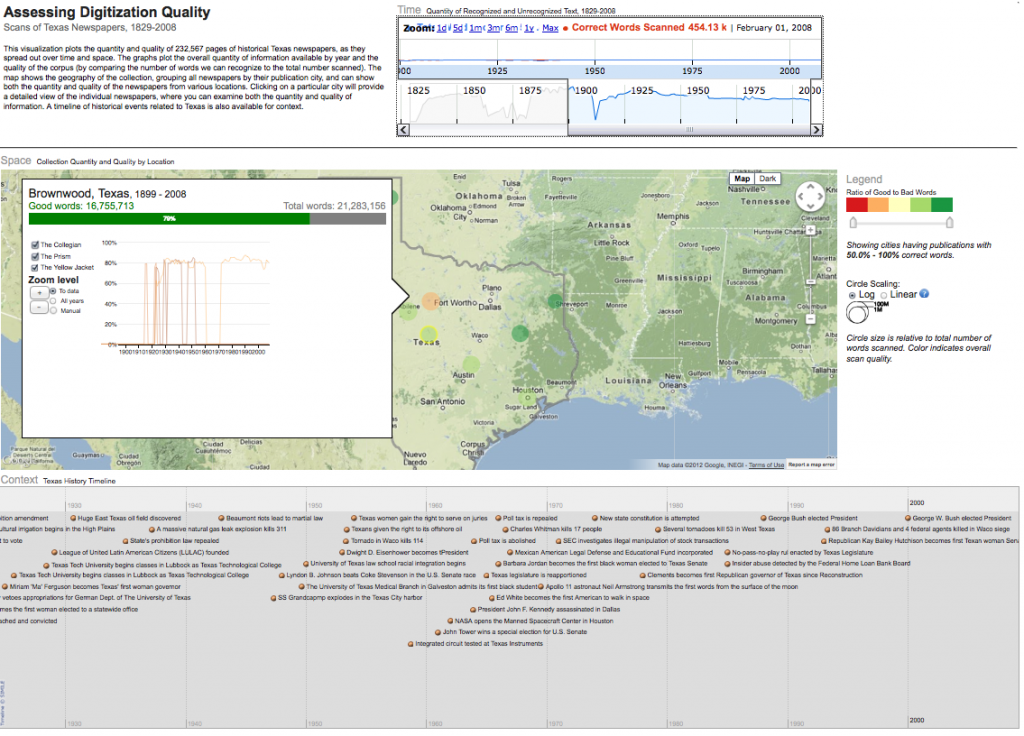
The first of these visualizations, “Assessing Digitization Quality,” measures the quantity and, more importantly, assesses the quality of OCR for these newspapers. It presents three visualizations. The first is a line chart that shows the overall quantity of available newspaper text (measured in number of words) and the overall quality of that OCRed text (measured as the ratio of recognizable words to total words) over the nearly two centuries these newspapers collectively span. The second is a map of Texas visualizing these quantities over space. The third is a handy timeline that provides some basic historical context by showing major events in Texas history.
Together these visualizations are certainly helpful for getting a quick sense of when and where the newspapers holdings for the Texas portion of Chronicling America are concentrated. They are also very useful for gauging the accuracy of the digitized text for particular time periods, locales, and newspapers. The assessments the developers of Mapping Texts have done reveal the accuracy of the OCR to vary substantially not just across time — with newspapers from the latter half of the twentieth century having significantly greater accuracy — but also across space. For instance, newspapers from the small towns of Palestine and Canadian have, respectively, OCR accuracy of 85% and 86%; on the other end of the spectrum, the newspapers of the town of Breckenridge only have an accuracy rate of 52%.

Assessing Language Quality provides measurements of quantity and OCR quality for locations and time periods
Beyond assessing the OCR quality of the newspapers, the creators of Mapping Texts applied a number of techniques to algorithmically correct errors. In this they have done a great service. While their techniques could only correct about a fifth of the identified errors, given the enormous number of errors that exist that number of corrections is substantial, certainly many millions of words. One hopes that these techniques will be further assessed, refined, and eventually applied to the entirety of Chronicling America to improve the overall quality of that valuable archive.
Measures of both the quantity and quality of such massive digitized corpora should be taken into account, the creators of Mapping Texts suggest, by anyone hoping to apply text-mining methods for analysis. Proposing in their white paper that “almost all research questions would first require a quantitative survey of the available data,” they provide a hypothetical example: “If poor imaging — and therefore OCR results — meant that ‘Lincoln’ was often rendered as ‘Linco1n’ [with a numeric 1 rather than an l] in a data set, that should affect how a scholar researching newspapers patterns surrounding Abraham Lincoln would go about his or her work.” This intuitively makes sense, and “Assessing Digitization Quality” is an extremely flexible and quick way to gauge the OCR quality of these newspapers at particular moments and places. But in what practical ways should a researcher compensate for these varying levels of quality? For example, what should a researcher interested in applying text-mining and visualization techniques to the newspapers of Breckenridge with its low 52% accuracy do differently than a researcher interested in Palestine or Canadian with their percentages of accuracy in the mid 80s? What difference does that 33% make? Can a given text-mining or visualization technique be successfully applied to the latter towns and not to the former one? Mapping Texts raises but does not address these important and admittedly complicated and challenging questions, leaving it to researchers to determine how they might take these measures of OCR quality into account in their research.
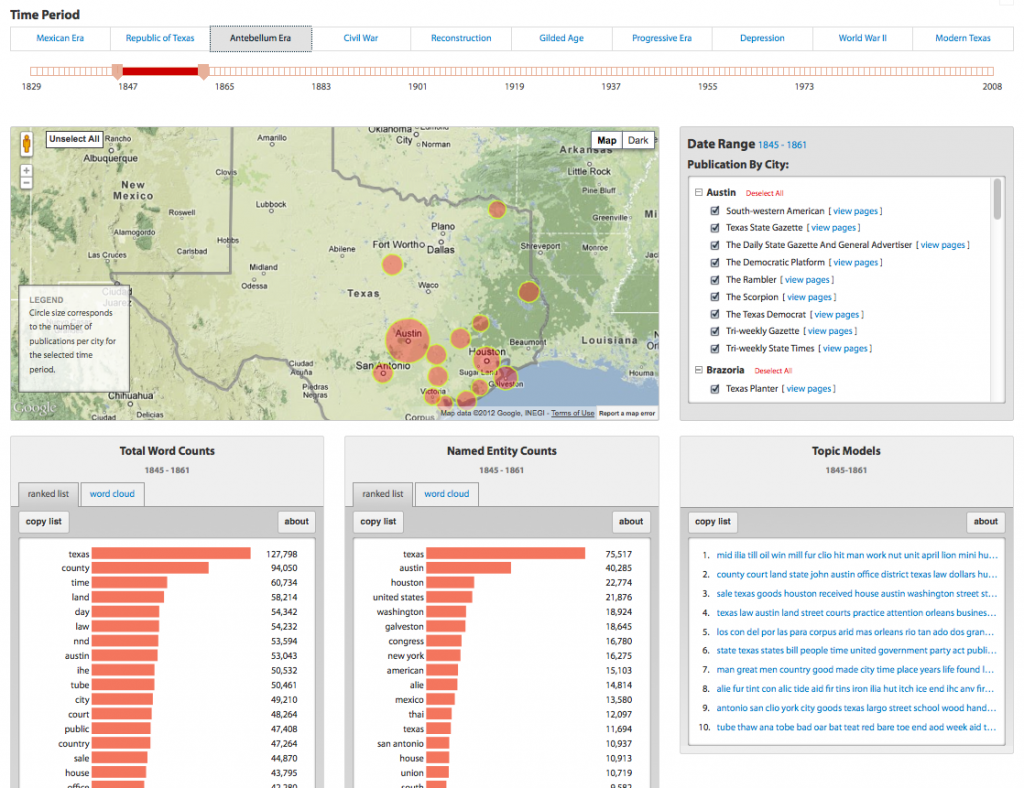
These measures aren’t taken into account by the creators of Mapping Texts themselves in the text-mining visualizations they provide in the second of the site’s tools, “Assessing Language Patterns,” which aims to allow researchers to explore some of the dominant language patterns in the newspapers. It presents three word visualizations along with a slider and map to limit results to particular spans of time and locations. The first provides a tally of the 50 most frequently used words for a selected time period, place, and newspaper (or some combination of places and newspapers). The second is much the same but limits the words to algorithmically identified “named entities” (persons, places, organizations, etc.). The third presents ten “topics” from a substantial number of topic models that were produced for preselected time periods (the Mexican Era, the Republic of Texas, the antebellum period, etc.) from all newspapers and from the newspapers of each city.[1] These views can provide a suggestive if somewhat rudimentary sense of some of the dominant language patterns across time and space. For instance, for each era “Washington” appears in the named entity list but its relative prominence changes substantially over time, from the 14th most frequently used named entity during the Mexican Era, growing in importance through the antebellum decades (5th) and Civil War (6th), and declining over the next century and a half to a low of 37th during the postwar era.
While certainly interesting, the kinds of patterns that can be detected using these views must be assessed very critically given both the techniques that are being employed and the types of newspapers that are present in Chronicling America for the different eras. For instance, the relatively low ranking of “Washington” during the postwar period likely conveys less about its importance during those decades than about the composition of the corpus: six of the ten newspapers for that period are college student newspapers, hardly representative of modern newspapers in Texas or straightforwardly comparable to the types of newspapers digitized for the out-of-copyright era. The counts of unigrams provided by Mapping Texts are undoubtedly useful for some researchers and some research questions, but they are a very limited metric for textual analysis; longer phrases are typically much more revealing as are more sophisticated text-mining techniques.
Another limitation of “Assessing Language Patterns” is the inability to move from any of the provided views into the newspapers themselves to study a suggestive or intriguing pattern in greater depth, in other words to move from the distant readings it affords to close readings of the texts from which it’s derived. For instance, providing a straightforward route from the topics into the texts themselves would have been welcome — functionality akin to that provided by David Blei’s topic model of the American Political Science Review or in my “Mining the Dispatch.” While the list of most frequent words for topics in a topic model often can provide a clear sense of a particular issue, theme, or genre, they are just as often ambiguous or even opaque taken by themselves. Sometimes reading them without reference to representative documents can be less like sound research and more like a Rorschach test — when read in isolation what one sees might reveal more about ones own preoccupations and knowledge than about the documents themselves. It is always useful and sometimes essential to be able to move from the word distribution of a topic to the documents that are highly representative of that topic to get a more subtle sense of its substance and meaning, a point Lisa Rhody thoughtfully illustrates in a recent blog post. (That said, it’s unclear how the creators of Mapping Texts defined a document. I don’t believe that the newspapers in Chronicling America are segmented by article, so they may have used pages or individual issues as the “documents” for their models. In that case it would be understandable if still regrettable not to provide a way of moving from topics into the texts.)
The creators of Mapping Texts should be applauded for taking on the daunting task of grappling with the entirety of an archive of enormous scale and scope and of a deeply imperfect nature. If Mapping Texts falls short in some respects, it still contributes to the challenging and slow project of developing new techniques to analyze the massive amount of digitized evidence that is now available. In particular, it does a service by highlighting the significant challenge of applying text-mining techniques to documents rife with OCR errors.
- [1]Scott Weingart recently provided a very useful and thoughtful overview of topic modeling in digital humanities for those unfamiliar with this technique.↩

