Digital Ethnography Toward Augmented Empiricism: A New Methodological Framework
Wendy F. Hsu
How Do Digital Technologies Deepen Ethnographic Practices?
Culture takes variegated forms, including lived experiences, social interactions, memories, rituals, transactions, events, conversations, stories, gestures, and expressive disciplines like music and dance. These processes and artifacts of social life make an ethnographer’s job as analyst and cultural documentarian dynamic and challenging. The increasing digital mediation in the field of ethnographic inquiry is undeniable. Through the engagement of individual users, governments, corporations, and even grassroots organizations, the ubiquity of computational technology has a far-reaching impact on social life. These technologies mediate culture by documenting, sharing, sensing, tagging, locating, trading, synchronizing, filtering, automating, remixing, and mining the everyday experiences of our research associates. Rather than walking away from the digital, we ethnographers should give serious considerations to software as infrastructure and materiality at the sites of our research. We should also be mindful of our own digital research practices as we utilize digital technology to organize, manage, and publish our field findings.
Most ethnographers are already using digital media and technology in our work. We use email and social media to identify and communicate with our research associates. We use cloud-based mapping systems like Google Maps to locate research sites during fieldwork. We use Internet media hubs like YouTube and Facebook to find, post, and share documentation of culture in action. As an ethnographer of sound-based cultures, I do traditional field research, capturing performances on my digital audio recording, taking field notes on Twitter and Storify, interviewing musicians in coffee shops, setting up shows for them, and sharing a stage with them. But with basic computational know-how, both applied and critical, I have had the opportunity to think wildly about what a mixed-method ethnography means to me. The use of technology such as webscraping has enabled me to accomplish the following:
- effectively gather relevant data in digital communities
- reveal the space and boundaries created by software infrastructures
- recontextualize findings from traditional field methods – in my case, in geographic terms
- illuminate how the physical/geographic conditions intersect with digital materiality
Scholarship on digital ethnography—in-situ engagement with people’s lived experiences through the frame or the implementation of digital media and technology—has fallen along a continuum between theory and methodology. For the most part, authors either have taken a “media ethnography” approach to consider the digital as a subject of research, analyzing the role and meaning of digital media in contemporary society (e.g. Miller 2011; Burrell 2012b), or have conducted “virtual ethnography” to explicate life in digital social environments (e.g. Boellstorff 2010). Others on the continuum have discussed the utility of digital technology as a tool of study. These authors have framed digital methods as an extension of face-to-face participant observation (Boellstorff, et al. 2012; Boellstorff 2013) and examined the affordances of digital communication technologies such as online forums (Kirshenblatt-Gimblett 1996) and social networking sites (Murthy 2008). Despite the rigor of this increasingly established body of scholarship, I find the methodological part of this conversation under-developed.
The purpose of this article is to expand the definition of digital ethnography and to shift the focus of the digital from a subject to a method of research.[1] We use computers, tablets, and smartphones to interact with communities, and to capture, transfer, and store field media. We use these tools because they are available to us and/or because they are vernacular to the communities that we study. Pushing the boundaries of computational usage in ethnographic research, I intend to foreground the role of digital technology as not only a utilitarian research tool, or a subject of inquiry, but as an emerging platform for collecting, exploring, and expressing ethnographic materials. And because the emphasis is on the “how,” the methods or mode of research, this framework makes room for the discussion of how to study cultures that are not born digital. A methodologically centered definition of digital ethnography can transcend the digital/physical binary that is more fraught in discourse than it is in the human experience of culture.
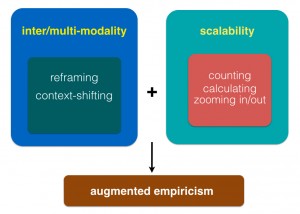
Ethnographers examine human interactions, expressions, and other cultural processes. These complex objects of inquiry require a human interpreter. Computers are ill-equipped to derive meaning from expressions, but they excel at calculating and reframing information. I refer to the first capacity as scalability, and the second as intermodality.
Scalability: With computers, we can complete a single task such as counting or calculating at lightning speed. This capacity can reveal patterns at a scale beyond human perception and cognition. Contents rescaled, as a result of zooming in or out, or scaling up or down, can offer us insights that we can then interpret with our complex knowledge of scholarly contexts. Scalability allows us to rethink how we sample culture. Our frame of inquiry can be scaled and this process of scaling and rescaling can create an analytic dialectic between close and distant readings (Moretti, 2007, p.1) of cultural processes. Using an ethnomusicological example: With computational means, we can shift our focus between the qualities of single musical gesture and collective patterns regarding the contour, shape, or depth of a performance practice of an entire genre community. Scalability enables us to not only examine a large sum of information; it also gives us the access to scrutinize the relationship between micro and macro observations.
Intermodality, or its corollary multimodality: Computational methods enable us to shift between a number of information contexts or modes of sense-based engagement. In an intermodal or multimodal exploration, new patterns and relationships emerge when contents and contexts collide. The ability to engage with a set of data or a single cultural artifact across various modes—e.g. visualizing sonic materials—could yield productive analytical outcomes. Further, the juxtaposition of two or more modes of scrutiny could enable the relational exploration across previously unrelated datasets. For instance, a digital map could reveal the relationship between music and place.
With the combined affordances of scalability and intermodality, we can forge a new perspective on field observations spanning between the micro and the macro. I call this “augmented empiricism,” a term that I use to describe the goal of finding and documenting social and cultural processes with empirical specificity and precision. To achieve augmented empiricism, we can use data and new informational discoveries to extend of our field-based knowledge. The integration of extended information by computational means could transcend human senses and cognition, and augment the scope of our empirical knowledge. A deepened engagement with cultural content in multiple registers could enable us to identify patterns of social linkage and cultural meanings that are otherwise inaccessible in participant observation methods.
I consider augmented empiricism a part of the ethnographic strive toward empirical precision. It is a form of immersion. In her discussion of ethnography in the era of big data, Jenna Burrell (2012a) cites Howard Becker to evoke the ethnographic goal in achieving empirical closeness — “the nearer we get to the conditions in which [the people we are studying] actually do attribute meanings to objects and events, the more accurate our description of those meanings are likely to be” (Becker 1996). To this notion, Burrell draws a distinction between ethnographers and big data scientists saying that the former “do a whole lot of complementary work to try to connect apparent behavior to underlying meaning.” Regarding the difference between ethnography and big data, Tricia Wang (2013) makes a case for an integrative approach that combines big data with ethnography.[2] Wang coins the term “thick data,” after Clifford Geertz, to refer to “ethnographic approaches that uncover the meaning behind big data visualization and analysis.”
Empirical immersion, I argue, is exclusive to neither the qualitative domain of ethnography nor the quantitative world of (big) data. While this division may reflect disciplinary or industry differences, we can resolve this methodological tension through a thoughtful consideration of data and computational treatment. With some technical interventions, we could employ a small or boutique data approach—using data to explore patterns and then raising questions that can be answered by qualitative approaches such as interviews and storytelling. This in-house integrative approach could help us extend our research engagement and forge a more comprehensive view of our fieldsite. Ethnographers, too, can achieve immersion through digital and simple computational means in our field research.
In this article, I examine how working with a variety of digital tools, including webscraping, mapping, and sound visualization, could widen the scope of ethnographic work and deepen our practice. I stay within the domain of data gathering in part one. In part two, I talk about the process of interpreting field data and the value of geospatial visualizations. The last part explores digital methods that magnify our perception of physical senses like sound, sight, and space. Throughout these discussions, I will also comment on the methodological, and where relevant, the social implications of these approaches.
Part One: Software Methods for Data-Gathering in Ethnography
Ethnographers are trained to engage with field materiality, to ask about the meaning of sense-based interactions and observations. Methods such as participating and observing have developed out of a history of physical and face-to-face ethnographic engagement. Digital mediation in and of the field site questions the methodological norm of participant observation. Tom Boellstorff (2013, p. 54-55) argues for a commitment toward participant observation as a method for researching digital sociality. He criticizes interviews or elicitation methods for leaving out tacit knowledge, or culturally significant information that is unarticulated by those within the tradition or community. Boellstorff foregrounds holism as a value of participant observation for “obtaining nonsolicated data—conversations as they occur, but also activities, embodiments, movements through space, and built environments” (2013, p. 55). He does so, however, without questioning the material riff between physical and digital modes of participant observation.
Software not only mediates but also reconfigures embodiments and interactions in a digital environment. This reconfiguration goes beyond just how the interface — in the case of a web site, the graphically organized wireframes and links — shapes our interactions. This upfront visuality is produced by complex code and backend algorithms. These algorithms reorganize our senses, translating a mouse click into sentiment expressions such as a “like” or relational gestures like “poke” on Facebook, or informational procedures like “share” or “retweet.” This reorganization changes how empirical knowledge is produced and transmitted among users in a digital environment. It also restructures how we as ethnographers observe, analyze, and categorize empirical knowledge. An ethnography that accounts for software materiality may contest the “‘trope of immaterality’ (Blanchette, 2011, p. 3), a discourse that alternatively celebrates or laments the disembodied nature of information technology” (Geiger 2014, p. 346-7). Through a software engagement with the field, as I show below, we can raise empirically driven questions that are beyond the limits of user interface, and interrogate the relationship between user interactions and programmed infrastructure.
A pragmatic tension between physical and digital materiality arises when we begin to design the methods for a digital ethnography. For the sake of methodological clarity, I propose to parse field interactions and observations based on the physical vs. digital binary. This procedural distinction serves a practical function in designing digitally enabled methods. I should note that this distinction is not necessarily a governing principle for theorizing field data, because physical and software materiality may converge in some contexts, and diverge in others.
In this section, I ask: How does one use computational or software tools to capture interactions and navigate in digital communities? What are the advantages of deploying software methods in an ethnographic project?
Building a Software Tool to Gather Data
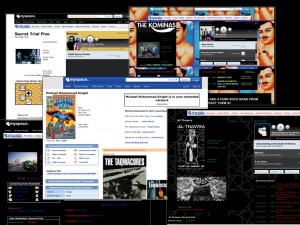
When I was writing my dissertation on Asian American musicians in independent rock music, I discovered that most of the musicians that I connected with spent more time online networking and promoting their music than actually performing, rehearsing, and recording. This shifted the site of my investigation away from the strictly physical clubs, bars, basement parties, and coffee shops where musicians hang out to include sites of digital social media exchange such as Myspace, Twitter, Facebook, and G-chat.
In particular, at the time of my fieldwork in the mid to late 2000s, I noticed that Myspace was a hot spot for social interactions. The musicians in my study used Myspace to extend their peer and fan networks beyond the borders of the United States. Many of them have forged connections with bands geographically based in Asia. I wondered what these online communities looked like geographically. Where in the world were the Myspace friends of my musician-informants located?
I set out to explore these bands’ digital social terrain beyond what Internet browsers display by leveraging software tools like webscraping. Webscraping uses a set of programmatic methods to extract targeted information from web pages.[3] To extract location information displayed on Myspace profile pages, I scripted a webscraper bot. I had to built the bot from scratch by writing the commands in the Ruby scripting language. Specifically I used the Mechanize ruby gem to navigate and extract the source code (through the use of XPath) of a series of targeted Myspace pages.
As an example of how I implemented this software tool, I offer my work with The Kominas, a South Asian American punk band iconic of the Taqwacore “Muslim punk” movement. During the period that I was webscraping, The Kominas had close to 3,000 friends on Myspace. These were all Myspace users who had requested friendship with The Kominas, or vice versa. My homebrewed webscraper successfully crawled through the profile pages of 2,867 friends of the band on Myspace and parsed the location-specific text in the source code of these pages. Because I planned on mapping these points, I scripted the bot to use the Geokit ruby gem to turn these friend locations into longitude and latitude coordinates.
This software method allowed me to transcend the default user interaction structured by the web interface. It opened up a realm of interactions with data at the level of code. This software engagement can be scaled and manipulated and was previously unexplored by academic participant-observers online. With the geographical information that I gathered from the bot, I mapped these friend locations. Having this set of data has allowed me to imagine my place-based findings in an ostensibly placeless digital environment (I will elaborate on this in the next section). Not only that, it has enabled me to deepen my qualitative analysis. From these findings, I generated further questions that are geographically and theoretically related to notions of space and place. Juxtaposing my findings from physical participant observation with software explorations, I discovered patterns of social behaviors and cultural meanings that I would not have had access to otherwise.
Discovering Software Boundaries Between Online Social Spaces
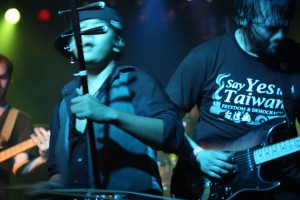
The use of a webscraping bot enabled me to reach beyond the end-user experiences of technology. Using a computational tool—a machine-based script that communicates with other machines—I was able to explore the software infrastructures in which my field interactions occured. This became apparent when my bot broke while trying to scrape location information from the friends of The Hsu-nami, a New-Jersey-based progressive erhu-rock band, on Myspace China.
In troubleshooting, I found that Myspace is in fact not as global as it has promised to be. The Myspace user networks of all (of the available) countries in the world exist on a server located in U.S., with the exception of the users of Myspace China. Hosted on a server in China, Myspace China is positioned institutionally apart from the rest of the Myspace networks in “the world.” Software plays a critical role in reinforcing the institutional and social boundaries between Myspace China and Myspace (U.S), where The Hsu-nami’s profile page is hosted. From this software-informed observation, I have gathered enough evidence to argue that there is not one single cyber space, but rather multiple cyber spaces. There are borders and boundaries—software- and hardware-dependent—that bind and separate these cyber spaces. And in the case of the Hsu-nami, forging connections with friends in China potentially suggests that ethnic meanings from musical sound and perform may transcend software barriers.
Webscraping: A Tool to Support and Uncover Neoliberalism
Earlier, I referred to my webscraping script as a bot. According to a technical definition, this bot takes the form of an Application Programming Interface (API). APIs are, by definition, a set of software components that act as an interface to communication across applications typically based in the web environment.[4] Even though this bot functions like a web API, its outside status—as a software entity that “runs alongside a platform of system, rather than being integrated into server-side codebases by individuals with privileged access to the server”—makes it fit the definition of “bespoke code” (Geiger 2014, p. 342). The renegade identity of my scraper bot does challenge the informational sovereignty established by Myspace to protect the value of its data. When I was researching software methods to answer my research question, I explored all the APIs made available by Myspace. My search revealed that none of the available Myspace APIs would query the information I needed. This information vacuum, by design, points to how Myspace has defined its boundaries of information and data. Software methods that reveal information valuable to the company would defy the company’s principles to monetize user information. My webscraping bot did exactly that — it leaked protected information that would otherwise be sold to companies with an interest in ethnic identities, music, and youth culture.
In Programmed Visions, Wendy Chun (2013) deploys the metaphor of sovereignty to discuss the politics of software architecture. In her comparison of computers to governmentality, she wrote:
Computers embody a certain logic of governing or steering through the increasingly complex world around us. By individuating us and also integrating us into a totality, their interfaces offer us a form of mapping, of storing files central to our seemingly sovereign—empowered subjectivity. By interacting with these interfaces, we are also mapped: data-driven machine learning algorithms process our collective data traces in order to discover underlying patterns (Chun 2013, p.9, my emphasis).
Chun contends that software is programmed to reinforce the logic of the market. The mapping-and-being-mapped dynamic embodies neoliberalism in an information-driven economy. Programmed to execute the neoliberalism, software processes information about and by the user. So when an individual user retrieves or consumes information, he or she becomes the object of consumable information. This equalization of roles between a consumer of data and a (inadvertent!) worker that sources valuable data with his or her human capital drives the market ethics that privileges entrepreneurism and voluntary individual actions (2013, p. 8).
Datamining is a pervasive practice for acquiring data related to the market. There are bots everywhere. Amazon.com stores our browsing patterns and user information in social media regularly gets mined as marketing research analytics. In light of these pervasive data practices, we as ethnographers should consider how we can repurpose these technologies to better understand the infrastructural context, thus closing our knowledge gap between (the cultural and social) content and the (technical and institutional) context of our scrutiny.
Part Two: Mapping as a Mode of Data Discovery
Ethnographers have raised concerns about the dominance of quantitative data amidst big data conversations. Rather than seeing it as a zero-sum game, some researchers have discussed the value of a mixed-method approach that combines field observations with data-driven quantitative methods. As a part of the “Ethnomining” series on the Ethnography Matters blog, Rachel Shadoan and Alicia Dudek discussed how they “make use of the strengths of both numbers and stories” in their study of Plant Wars, an online text-based fighting role-playing game (2013). They used visualization of server log data that displays patterns of the community’s gaming activities as scaffolding for guiding interviews and field observations. Quantitative findings provided the map, answering the “the how and what questions,” while ethnographic insights gave “the key to that map, answering the why questions” (Shadoan and Dudek 2013). In her well-cited blog post “Big Data Needs Thick Data,” Tricia Wang argues that the role of ethnography is to provide an explanatory context for big data findings (2013). Without the thick, immersive perspective that ethnography can offer, over-reliance on big data may lead to asking wrong questions, making uninformed, illusory correlations, and having a cognitive bias that narrows the scope of inquiry.[5]
Ethnographers who advocate for a mixed-method approach see the collaborative potential between quantitative and ethnographic (or qualitative) researchers. To fully conceptualize a complementary relationship between ethnography and quantitative methods, I contend that we need to rethink the role of quantitative data. Data in conventional quantitative methods play a passive role. It serves information that either supports or disproves hypotheses. It functions as objects of test, measurement, and control. To use a Foucauldian metaphor, data is disciplined by the principles of scientific method and its underlying positivist ideology. However, in these mixed-method examples, my work included, data plays an active role to facilitate the imagining, recontextualizing, and extending of empirical knowledge.
What we need is generative data, not disciplined data. As an interpretive practice, ethnography allows data to elude categorical boundaries of knowledge and to help us discover new interpretative and speculative territories. Enabling data to fit the interpretive paradigm and to flow across the quantitative and qualitative divide requires the unleashing of data from the disciplinary compartmentalization of science.
To illustrate the generative potentials of data within an ethnographic framework, I draw examples from my own experiments with data extracted from Myspace. My discussion offers a close reading of the methodological exchange between quantitative and qualitative sources. Additionally, I use this discussion as an opportunity to diverge from the current disciplinary focus on text. Instead, I want to highlight the digital capacity to engage with information in sensory modes beyond the textual. We know that qualitative programs are great at the conventional machine-processing such as counting, sorting, and annotating. But information resides in many modes, allowing a focus on the spatial, geographic, and positional as a context of data analysis can lead to unexpected findings.
Transforming the Role of Geography in Ethnography
Maps in their static form represent the spatial relationship between objects in space. But mapping as a dynamic interpretive practice can help discover spatial patterns and generate place-based questions. Emergent GIS technologies provide a platform of place-based discovery that can be particularly useful in multi-sited field research. I advocate for the practice of dynamic mapping that associates the locales of our field findings to geographic information. This association can, in turn, contextualize qualitative data in a geospatial form for the purpose of analysis. In this sense, geography transcends its former role as a context of analysis to become a part of the content of field data analysis.
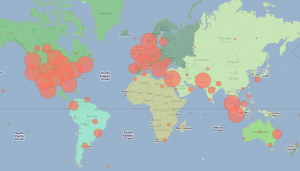
After I developed a webscraping bot to extract geographical information from Myspace, I turned the harvested data (in the form of .csv files) into a meaningful visualization. I used OpenLayers, an open-source web mapping resource based in JavaScript to create a dynamic map that indicated the physical locations of the band’s Myspace friends and performance tours. To contextualize the reading of the physical points, I added a Google street map layer to label the visualization with the proper name of countries and cities. I also added a layer of world’s regions to distinguish the continents. Finally, I turned the points into clusters.
I created the clustering patterns based a hand-scripted visual algorithm using Javascript in OpenLayers. This algorithm of visibility is programmed to articulate the transnationality over a mathematical depiction of friendship distribution. It balances point density and readability, while adjusting the contrast between the smallest and the largest clusters. In this instance, a single-point cluster could still be seen and the largest concentration of the friends located in northeastern United States would not dominate the entire map. This visual algorithm enables the foregounding of the band’s friends located outside of the United States, thus orienting my engagement with theoretical framework of Asian American transnationality. The resistance to the compulsive privileging of numbers in science is mediated by a bespoke programmatic means that is ultimately driven by my interpretive goal of understanding the geography of Asian America as imagined and forged by musicians. I wanted to let humanistic inquiries, instead of mathematical principles, shape the contour of data visualizations. Contrary to the role of the data in a scientific method, the data here are explicitly biased. They tell a story about meaning of music making in the lives of Asian American indie rock musicians.
Mapping as a Mode of Discovering
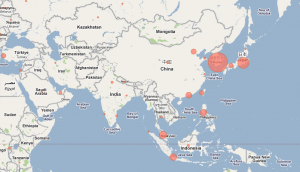
Playing with these dynamic digital maps (example map of The Kominas), I discovered new visual and geospatial patterns of the bands’ global friend networks. These maps, quite literally, make visible communities that were previously invisible. This has particular implications within the discursive context that renders the Asian American subject silent and relegates Asian American artists to a marginal social position in the independent rock music scenes. These maps also offer evidence of the musicians’ establishment of a transnational stronghold through social networking.
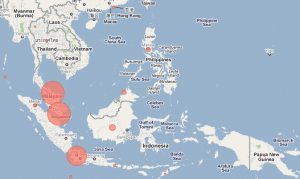
The maps’ capacity for zooming in and out afforded me insights on the contour and content of these unique music diasporas. In the case of The Kominas, a band with Pakistani and Indian American membership, I discovered a substantial presence of friends in South and Southeast Asia. The band’s friend base in Pakistan is most likely tied to the members’ heritage and personal relationships to the country. But the friend distribution in Malaysia and Indonesia came as a surprise (to me and the band) because the members of the band have no personal connections to these places.
Seeing the band’s friendships in Southeast Asia led to a new line of inquiry about The Kominas’ perception of punk in geographical terms. This discovery spurred my interest to further examine the band’s goal of de-centering the punk music terrain away from the US and the UK. In an interview, bassist Basim Usmani defended his position against an interviewer’s assumptions about the geographic spread of punk within the Anglophone world. In his comment, Basim expressed his feelings of connection to Pakistan and Malaysia:
Punk is ten times bigger in Kuala Lampur [sic] than it ever will be in the UK, France, or Germany. Or America. No, the reason for forming the Dead Bhuttos, and the rush to put a single online was to show, at least cosmetically, that Pakistan was as capable of putting out punk rock as Turkey, Malaysia, Japan, and Lebanon. The USA is good to sell obscure Malaysian and Japanese records in, but it’s not a good place to play this kind of music. We’d do much better in South Eastern Asia, which yes, we get a lot of traffic from online. Tons of people from Singapore, Malaysia, and Indonesia add us. We’ve been covered in the major Malaysian music magazine. I think it makes more sense for us to play in Malaysia than it does to play in Europe (Rashid, Foley, Usmani, & Khan, 2010).
Basim relegates the U.S. to a place of music commerce that spawns consumption, but is not fruitful for the production of punk music. Seeing the U.S. and the rest of the Anglophone world as sites of punk inauthenticity, he gravitates toward Asia and validates it as a more legitimate site of production of punk rock.
Using this map, I was not only able to discover a new pattern of the band’s communities on Myspace, but also to facilitate my analysis of the qualitative observations made about the band’s feelings of connectedness toward Asia. This map did something similar to the function of thick data as formulated by Tricia Wang (2013). Playing an interpretive role, the map introduced a new line of inquiry by sifting through qualitative data such as interviews and field observations. Different from Wang’s model, quantitative information recontextualized qualitative findings. This new geographical frame led me to look deeper into the meaning of space and place in the band’s interviews and music. Eventually, this movement between quantitative and qualitative data sources generated a robust empirical foundation to question existing punk scholarship that marginalizes South Asian subjectivity (e.g. Hebdige 1979, p. 32).
Furthermore, intending to use the maps as a springboard to generate the bands’ thoughts on their perception of Southeast Asia and its punk scenes, I followed up with one of the band members in a phone interview. When I told Basim about the map, he revealed his impression of the punk music scenes in Indonesia and Malaysia and the role of religion in those scenes. He also proposed the idea of using the map to pitch a tour in Southeast Asia. His response illustrates an unusual perspective on the ethics of reciprocity in field research. My gift in exchange for the band’s time spent with me, in this case, was “marketing analytics” that displayed evidence of their global following. I have no idea if the band actually used the map for organizing their performance tours. But knowing that my visualization, an outcome of my ethnographic analysis, would help promote the band adds an expected but pleasant twist to the meaning of ethnography in the contemporary, information-driven age. Also, this map has contributed to the public perception of the band and its role within the Taqwacore movement. Wikipedia contributors cited this map as evidence for The Kominas’ global following on the Taqwacore page.
A More Meta View
I came at these maps with an interest in the bands’ transpacific connections. I produced a map for each one of the bands that I studied. On these maps, when I zoomed in and compared the region of Asia between bands, I saw patterns a that visualized a unique “Asia.” Each of these American indie rock artists of Asian descent created a distinctive community through the practice of “friending” on Myspace. Seeing visualizations has helped me theorize the meaning of Asia from the perspective of each Asian American musician and makes visible the contour of transnationality between Asia and Asian America as forged through online communication. I discovered patterns of friend distribution that reflect the ethnic and geographical affiliations of each group. On my blog, I compared the geographical results between The Kominas and Kite Operations, a New-York-based band with mostly Korean American membership and Myspace friend distribution in East Asia.
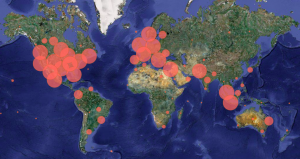
When I zoomed all the way out, I saw a representation of a radically transnational community created by these bands. I played with the various base layers — street vs. satellite layers — depending on the content specifics of the narrative I’m trying to communicate. I often use the satellite view of The Kominas’ friend map to convey a global social geography, one that was spawned in the digital environment of Myspace and has certainly spilled into the physical lives of the members of the community.
Myspace was more than a phonebook or an index of friends. It was a space where actual relationships were transformed. What the map divulges is a sociocultural space created by punk rock sound and the exchanges of mix-tapes, mp3s, face-to-face visits, shows, tweets, zines, blog posts, hyperlinks, virtual hugs, encouragement and strength. In a way, I find the story much more compelling when told in the presence of an interpretive map. This visual narrative powerfully transcends the east-vs-west, American-vs-Muslim geopolitical binary that is so entrenched in the post-9/11 discourse. The Kominas has reconfigured the world’s map and created its own punk rock diaspora.
Music articulates space; as importantly, it travels in space. The relationship between two sensory-rich modes calls for a new methodology. These maps provide an empirical mode to cross-examine the relationship among music, meaning, and space (Hsu 2013). I see my maps as the beginning efforts to concretize the relationship between music and migration, among others such as the Lomax Geo-archive, Sound Maps at the British Library, Radio Aporee, and the Musical World Map of New Media Lab at Graduate Center of CUNY.
Digital technologies afford us the capability to engage with empirical data in multiple modes and at multiple levels. The combination of scalability and intermodality mobilizes the algorithms of visuality to make apparent both the micro and macro patterns of cultural content that were imperceptible to the human eye. The programmed dynamic between visibility and invisibility, and the design separation between interface and algorithm, according to Wendy Chun, is not without politics. “When the computer does let us ‘see’ what we cannot normally see, or even when it acts like a transparent medium through video chat, it does not simply replay what is on the other side: it computes” (Chun 2013, p. 17). The tension between (interface-level) transparency and (algorithmic) opacity is not incidental, but is structural in design of software technology. I’d like to think that my digital methods have reclaimed the software logic by exposing what is behind the seemingly transparent web interface of Myspace. The infrastructural position of these relationships doesn’t transcend the neoliberal market ethics. Nevertheless, my software intervention — through unveiling data only algorithmically available to machines — enables me to tell a story about the meanings of transnational communities for a group of often invisible individuals.
Part Three: Magnifying the Physical Materiality of Culture
Most ethnographers immerse themselves by being physically present at a fieldsite, learning the language, and participating in activities that are meaningful to the community. While many virtual ethnographers translate participant observation into a digital environment, many of us ethnographers still engage in in-situ, place-based work, finding patterns in physical observations of conversations, facial expressions, body language, spatial occupation, and other physical interactions. Observation and participation, for most of us, are physically defined and are bound to physical forms of co-presence with the community. The process of field immersion makes face-to-face interaction an ethnographer’s bread and butter. How then does the digital facilitate this critical engagement that is sense-based and materially embodied?
Physical and digital materiality, I argue, are not mutually exclusive. Conceptualizing the digital in opposition to the physical reinforces the familiar online-offline or virtual-physical dichotomy. This notion reifies categorical thinking that defies the experience of digital anthropologists and our research associates. It also creates an unnecessary methodological barrier in deploying digital technology in performing our work in the myriad fieldsites in which we find ourselves. Through the lessons of field recording, we have learned to capture live interactions using (analog) recording technology. Besides playing back and collecting these field recordings, we don’t think too much about how technology can help us explore and analyze these sense-based documents of cultural life.
I think of the digital as an extension of our physical senses. With the tools at our disposal, we could digitize many elements of life. Digitizing serves many purposes beyond organizing and managing. The critical capacity of scaling and intermodal play enables us to scrutinize the materiality of objects of our inquiry, an artifact or a field recording. Deploying technologies that sense, rescale, and visualize, I contend, could render the textures of culture and dynamics of social life in relief.
Seeing the Textures of Sound
After I finished my dissertation last year, I started a second project about a postcolonial itinerant music-culture in Taiwan known as “nakashi” (那卡西) through the lens of street-based market economy, tourism, disability, and technological innovation. On my last trip to Taiwan, I was lucky enough to get my hands on a set of cassettes featuring a group of nakashi musicians entitled The Wandering Blind Singers. Judging by its low-budget packaging, I surmised that the tape set was released at a low volume. Other than that, I wasn’t able to acquire more information about the featured recording artists and the recording’s production and distribution context.
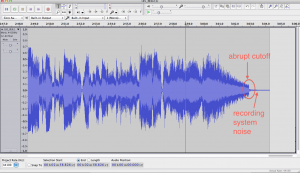
As an ethnographer who works primarily with sound, in the form of field recordings, interviews, and music recordings, I have found utility in leveraging digital audio workstation [DAW] for analytical purposes. During the process of digitization of the cassette collection, I noticed sounds that were extraneous to the content of the music. Opening the recording in Audacity, a free and open-source audio workstation program, I quickly saw that the recordings in this tape set are done in mono. This is unusual since most studio recordings in Taiwan have been produced in stereo since the late 70s. Looking at the waveform, which displays the change in amplitude (volume of sound) over time, I found that many of the tracks end before the natural decay of the instruments. You can see an abrupt amplitude reduction.
Upon closer listening, I discovered an occasional environmental sound seeping through the walls of the studio. In one song, the sounds from a vehicle moving on the street were captured in the recording. All of these observations add up to an amateur low-fidelity and low-budget production quality. These characteristics, in the context of the recording history in Taiwan, are rather unusual. My conjecture is that these recordings were done in a radio station’s broadcast studio. Conventionally, radio broadcast studios are ill-equipped to produce professional music recordings. Captured as live performances on a radio show, the recordings were mostly likely produced by sound engineers trained to produce radio programs, which requires knowledge that is procedurally distinct from music production. This method of recording, perhaps, was the only economically viable option for the nakashi musicians. This close listening to the unwanted noises of the tracks, facilitated by the use of a digital workstation, offers nuances to sonic signifiers associated with the trope of “nakashi” and “of the street” in postcolonial Taiwan. It also potentially sheds light on the narrative about musicians’ fringe position in the music industry, and their lower-class status in the society at large.
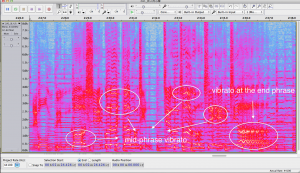
In addition to close listening, distant listening is another instance of computational scaling of audio analysis. Sparked by Tanya Clement’s (2012) work on distant listening as a technique to illuminate sonic patterns of Gertrude Stein’s poetry, I began looking at the spectrograms of these recordings. In contrast with waveform, spectrograms reveals patterns of frequency (as well as amplitude) changes over time. Thankfully, Audacity makes this mode of sound visualization available through only one click.[6] Spectrograms illuminate details in frequency fluctuations, critical information in the analysis of the stylistic qualities and vocal timbres of nakashi singers. Notably, these singers’ tight, enka-inspired vibrato stands out visually as horizontal wiggles on the spectrogram. You can listen to this particular portion of the song on SoundCloud. This mode of visualization would be useful in exploring the stylistic contours of vibrato across the related musical genres.
Seeing Leads to Further Inquiries
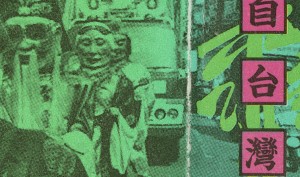
Computational rescaling can be applied to visual content (video and photographs). I stumbled upon surprises during the process of digitizing the album art and liner notes of the nakashi tapes. After scanning and then zooming in on the image, I gained a closer view of the granularity of the album art to discover traces of its print production.
As an example, I take a cassette entitled Sounds from Taiwan’s Underclass Vol. 2, a mix of field recordings and low-budget studio recordings, among others, nakashi artists and Catholic worship songs of Taiwanese aboriginal groups compiled by renown music critic He Yingyi. The cassette was released by the Taiwan’s historically important indie label Crystal Records in 1995. After zooming in on the artwork, I discovered an unusual dotted pattern in black ink that underlies a few color layers.
According to my archivist colleague, this pattern indicates that the album art was printed via the halftone technique. Without knowing the history of print in Taiwan, I gathered that this print work was done inexpensively. By the mid 1990s, Taiwan was the major site of manufacturing of computational components. Halftoning, a common print technique a few decades prior to the 1990s, would have been considered obsolete in the time of the cassette’s production. The production history of this recording series reveals a history of technology that is empowered by digital technology. According to the record label’s back catalog, the series was also released as a laser disc with Vol. 1 of the 2-part series printed as a double-CD set in the 1991. Given this production context, I suspect that there might have been another intention, besides saving cost, behind the choice of halftoning the album art. My guess is that the halftone technique was deployed to signify the music’s associations to the social underclass of Taiwan. This observation, of course, is only the beginning of further explorations of cassette and print culture and the meaning of analog media in Taiwan. These inquiries lead to traditional qualitative research like archival and ethnographic methods.
Extending the Spatial Sense
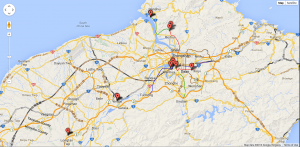
Through the use of increasingly available sensing technologies, we can collect data pertaining to not only clicks on websites (big data type sources), but also embodied data related to sound, sight, gestures (e.g. Kapur 2008), and positions. GPS tracking is perhaps the most accessible form of this kind of technology. In my field research in Taiwan, I have been experimenting with mobile mapping technologies by using GPS to log live location information to track the ad hoc performance locales of the remaining musicians of the nakashi tradition. Not only that, I have been able to deepen my analysis by identifying possible spatial correlations between performance locations and urban landscape and infrastructures.
GPS is useful for bridging the gap between maps, a visual mode that articulates a particular perspective of space, and individuals’ actual kinesthetic experience in space. It adds an interpretive layer to maps that claim scientific objectivism, a perspectival and (inter)subjective layer (Google Maps is an example of this). The mashing between visual, spatial, and informational modes enables us to imagine new conceptual relationships. It also produces a production tension between institutional and non-institutional or individual sources of knowledge, unveiling the politics of visuality.
Looking at the street music performance map as I continue to populate it, I have generated the following questions to further my investigation: Since the nakashi culture in Taiwan spawned along the Danshui River during the Japanese Occupation era, how has it deviated from its place of origin? Do these nakashi musicians, mostly in their 50s through 60s, still hang out in their old stomping grounds in the Beitou and Wanhua districts of Taipei? How is this street music culture spatially related to present and past patterns of tourism, migration, urban development and renewal projects? How does visualizing the physical presence of underclass musicians challenge the city’s official representation of itself? How does this map remediate or remap the relationship between politics of visibility and ongoing issues like class, disability, and postcolonial ethnic tensions in Taiwan?
In my three-week pilot study, I used the Google Maps app on my smartphone to email the exact lat-long coordinates of the performance sites that I encountered in the field. I then input the coordinates, along with other information relevant to the performance, into a spreadsheet in Google Fusion Tables. With the one-click “Map of Locations” tab, I plotted the locations of these street performances as points on a map that users can click to display media and contextual information of each performance. Another utility of GPS technology is tracking routes. Using a combination of mobile apps like MyTracks and Google Maps,[7] one could document movement and migration in urban ethnography projects.
Horizontal vs. Vertical Immersion
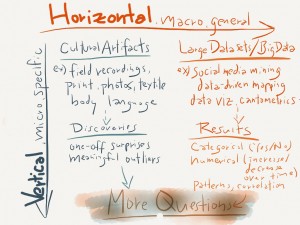
I introduced the idea of augmented empiricism earlier. Employing digital affordances such as scalability and intermodality, we could achieve a new kind of immersion that allows us to gain a closer engagement with our field data. This kind of computation immersion, I think, can be thought of in two different directions: horizontal and vertical. Horizontal immersion explores general contours of social actions and events. It provides categorical answers and engages with a large number data set typically. Projects that are heavy on the side of datamining (e.g. my Myspace project or Alan Lomax’s cantometrics) take on a horizontal contour.
A vertical immersion approach, on the contrary, engages with a single artifact (event, dialog, photo, textile, gesture) that rescales or represents patterns of cultural life across modalities. The techniques that I discussed in this last section would fall into this category. Visualizing sound and magnifying images as interpretative interventions afforded me a closer access to the subtle nuggets of meaning that often resists categorical thinking. Most ethnographers I know engage with their objects of study in both horizontal and vertical manner, but we use a different term to refer to this binary, generality-specificity, and macro-micro. My hope is that this binary reconfigures the discipline-based opposition between quantitative and qualitative methods that I have tried to deconstruct.
Conclusion
Ethnography and digital humanities are similar in that they are both transdisciplinary and praxis-driven. The transdisciplinary synergy of digital humanities has generated a community of scholars who have experimented with new methods and modes of scholarship across and around academia. Similarly, ethnographers have fostered cross-discipline and cross-sector community exchanges of thoughts and tips related to their praxis.
The purpose of this essay is to offer an emerging methodological framework in thinking about digital ethnography. Through examples of my software experimentation within and around the black box of technology, I hope that I have sparked some interest in creative engagement with digital methods in ethnography. Research data and method design are best when they are informed by an empirical perspective. My hope is that you will find similar inspiration in your own research.
Digital ethnography as I have methodologically reframed is not fundamentally different from traditional ethnography. We have learned much from doing things across the silos of the society and the academy because doing in the form of participation, as opposed to thinking or theorizing alone, is humbling and it pushes the boundaries of our horizons. This multiplicity—in senses, modalities, information sources, languages, categories, data types, and frames of analysis—speaks to a juncture at which technology underlies the change in form and content in our social life. In addition to speculating and theorizing this change, we should heed the praxis axiom of ethnography to open up the black box of ethnographic methodology, so that we can experiment with how we practice, embody, and enact the lessons from the field. Maybe then we can be better informed as we shape the development of technologies that undergird our work.
Originally published by Wendy F. Hsu on April 18, 2012, August 7, 2012, October 27, 2012, December 5, 2012, and January 25, 2013. Revised for Journal of Digital Humanities March 2014.
Acknowledgements
I am thankful of Bethany Nowviskie, Joe Gilbert, Tricia Wang, and the Ethnography Matters community for their support for and thoughtful response to my work.
List of Works Cited
Becker, Howard. 1996. “The Epistemology of Qualitative Research,” Ethnography and Human Development: Context and Meaning in Social Inquiry, edited by Richard Jessor, Anne Colby, Richard A. Shweder, Chicago, I.L.: University of Chicago Press.
Blanchette, Jean-François. 2011. “A Material History of Bits,” Journal of the American Society for Information Science and Technology, 62(6), 1042-1057. Doi: 10.1002/asi.21542
Boellstorff, Tom. 2010. Coming of Age in Second Life: An Anthropologist Explores the Virtually Human. Princeton, N.J.: Princeton University Press.
Boellstorff, Tom. 2013. “Rethinking Digital Anthropology”, Digital Anthropology, edited by Heather A. Horst and Daniel Miller, New York: Bloomsbury.
Boellstorff, Tom, Nardi, Bonnie, Pearce, Celia and T. L. Taylor. 2012. Ethnography and Virtual Worlds: A Handbook of Method. Princeton, N.J.: Princeton University Press.
Burrell, Jenna. 2012a. “The Ethnographer’s Complete Guide to Big Data: Answers (part 2 of 3).” Ethnography Matters, Retrieved from: http://ethnographymatters.net/2012/06/11/the-ethnographers-complete-guide-to-big-data-part-ii-answers/ (accessed on February 20, 2014).
Burrell, Jenna. 2012b. Invisible Users: Youth in the Internet Cafés of Urban Ghana. Cambridge, M.A.: Massachusetts Institute of Technology Press.
Clement, Tanya. 2012. “Sounding Stein’s Texts by Using Digital Tools for Distant Listening,” http://tanyaclement.org/2012/01/12/sounding-steins-texts-by-using-digital-tools-for-distant-listening/ (accessed on February 20, 2014)
Chun, Wendy Hui Kyong. 2013. Programmed Visions: Software and Memory, Cambridge, M.A.: Massachusetts Institute of Technology Press.
Geiger, R. Stuart. 2014. “Bots, bespoke code, and the materiality of software platforms,” Information, Communication & Society, 17:3, 342-356, DOI: http://dx.doi.org/10.1080/1369118X.2013.873069
Hebdige, Dick. 1979. Subculture: The Meaning of Style. London: Methuen & Co, Ltd.
Hsu, Wendy. 2013. “Mapping The Kominas’ Sociomusical Transnation: Punk, Diaspora, and Digital Media,” Asian Journal of Communication, Volume 23, No. 4, pp. 386-402. DOI: http://dx.doi.org/10.1080/01292986.2013.804103
Kapur, Ajay. 2008. Digitizing North Indian Music: Preservation and Extension using Multimodal Sensor Systems, Machine Learning and Robotics. VDM Verlag: Dr. Muller, Germany.
Kirshenblatt-Gimblett, Barbara. 1996. “The Electronic Vernacular,” In Connected: Engagements with Media, G.E. Marcus (Ed.), Chicago, I.L.: University of Chicago Press, pp. 21-66.
Miller, Daniel. 2011. Tales from Facebook. Malden, M.A.: Polity Press.
Moretti, Franco. 2007. Graphs, Maps, Trees. New York: Verso.
Murthy, Dhiraj. 2008. “Digital Ethnography: An Examination of the Use of New Technologies for Social Research,” Sociology, 42, 837-855. doi: 10.1177
Rashid, H., Foley, K., Usmani, B., & Khan, S. 2010. “Taqwacore Roundtable: On Punks, the Media, and the Meaning of ‘Muslim.’” ReligionDispatches.
Seaver, Nick. 2013. (2013, November). “What should an anthropology of algorithms do?” Paper presented at AAA. (accessed March 24, 2014).
Shadoan, Rachel, and Dudek, Alicia. 2013. “Plant Wars Player Patterns: Visualization as Scaffolding for Ethnographic Insight,” Ethnography Matters. (accessed on March 31, 2014).
Wang, Tricia. 2013. “Big Data Needs Thick Data.” Ethnography Matters. (accessed on February 20, 2014).
- [1]A few anthropologists have discussed the methodology of digital or virtual ethnography as a discursive framework. In contrast, my contribution to this methodological conversation focuses on method as a research modality. This praxis-based perspective is meant to provide a practical toolkit for scholars of interest. This perspective critically engages with the empirical part of the research process. It is potentially a critical commentary on the over-privileging of theory over praxis in published scholarly discourse. My approach touches on a larger conversation regarding the interpretative and social “science” divide within anthropology and related disciplines like ethnomusicology. For more on the methodological tension between interpretive and algorithmic (or mathematical) approaches to anthropology, read Seaver, N. (2013, November). What should an anthropology of algorithms do?, Paper presented at AAA. Retrieved from http://nickseaver.net/papers/seaverAAA2013.pdf (accessed March 24, 2014).↩
- [2]As a part of the “Ethnomining” series on Ethnography Matters, authors such as David Ayman Shamma and Sharon Shadoan & Alicia Dudek have made compelling cases for an integrative or hybrid approach that combines quantitative data processing with ethnography.↩
- [3]The term ‘webcrawling’ is sometimes used synonymously with web-scraping. Typically crawling refers to the technology of extraction of all information on the web, similar to the technology of Google search engines. Web-scraping refers to the extraction of specific online information.↩
- [4]An example of an API is Twitter client (for example, Tweetbot, Tweetdeck). Instead of using Twitter via Twitter.com, developers have leveraged the robust Twitter API to make available apps for users to interact with Twitter via a computer, tablet, mobile or smart phone. For more on API, read this friendly explanation of API.↩
- [5]Wang has continued her work on Thick Data in other venues. She presented a developer version of her work at the O’Reilly Media webcast on March 28, 2014. Retrieved from http://www.oreilly.com/pub/e/3020 (accessed on March 28, 2014).↩
- [6]If you’re interested in playing with spectrograms in Audacity, I recommend this video tutorial by Matt Thibeault.↩
- [7] At a mapping workshop at Occidental College, I asked the students to use different modes of transportation and track their individual route from the library to the auditorium on campus. Using the MyTracks app, the students documented their unique tracks, sent them as .gpx files. They imported these .gpx files into a shared customized map using Google Maps. The resulting map shows the idiosyncratic routes that each student group took. Here’s a great tutorial produced by one of my students. A small-data and free alternative to Path Intelligence, this method could be potentially useful as a way to document informants’ movement and migration in urban ethnography projects.↩

