Big? Smart? Clean? Messy? Data in the Humanities
Christof Schöch
This paper is about data in the humanities.[1] Most of my colleagues in literary and cultural studies would not necessarily speak of their objects of study as “data.” If you ask them what it is they are studying, they would rather speak of books, paintings and movies; of drama and crime fiction, of still lives and action painting; of German expressionist movies and romantic comedy. They would mention Denis Diderot or Toni Morrison, Chardin or Jackson Pollock, Fritz Lang or Diane Keaton. Maybe they would talk about what they are studying as texts, images, and sounds. But rarely would they consider their objects of study to be “data.” However, in the humanities just as in other areas of research, we are increasingly dealing with “data.” With digitization efforts in the private and public sectors going on around the world, more and more data relevant to our fields of study exists, and, if the data has been licensed appropriately, it is available for research.[2] The digital humanities aim to raise to the challenge and realize the potential of this data for humanistic inquiry. As Christine Borgman has shown in her book on Scholarship in the Digital Age, this is as much a theoretical, methodological and social issue as it is a technical issue.[3]
Indeed, the existence of all this data raises a host of questions, some of which I would like to address here. For example:
- What is the relation between the data we have and our objects of study? – Does data replace books, paintings and movies? In what way can data be said to be representations of them?
- What difference does it make to analyze the digital representation or version of a novel or a painting instead of the printed book, the manuscript, or the original painting?
- What types of data are there in the humanities, and what difference does it make? – I will argue that one can distinguish two types of data, “big” data and “smart” data. What, then, does it mean to deal with big data, or smart data, in the humanities?
- What new ways of dealing with data do we need to adopt in the humanities? – How is big data and smart data being dealt with in the process of scholarly knowledge generation, that is when data is being created, enriched, analyzed and interpreted?
1. What is data (in the humanities)?
As a starting point, it is useful to define what we mean by “data” generally and in the context of research in the humanities. First of all, let’s remember how data is generally defined. Information scientist Luciano Floridi defines data at its most basic level as the absence of uniformity, whether in the real world or in some symbolic system.[4] Only once such data have some recognizable structure and are given some meaning, can they be considered information. Floridi’s very general definition of data also shows why data can be represented in many different formats and on many different supports. Digital data is special in that it is discrete rather than continuous, and is usually represented, at its most fundamental level, in the form of a binary notation involving just two symbols, 0 and 1. On a higher level, digital data are usually represented and processed in data structures that can be linear (for example arrays and matrices, like lists and tables in a data sheet), hierarchical (with a tree-like structure in which items have parent-child or sibling relations with each other, as in an XML file) or multi-relational (with each data item being a node in an interconnected network of nodes, as in graph-based databases).[5]
Some additional distinctions are important. For instance, there is structured and unstructured data as well as semi-structured data. Structured data is typically held in a database in which all key/value pairs have identifiers and clear relations and which follow an explicit data model. Plain text is a typical example of unstructured data, in which the boundaries of individual items, the relations between items, and the meaning of items, are mostly implicit. Data held in XML files is an example of semi-structured data, which can be more or less strictly constrained by the absence or presence of a more or less precise schema. Another important distinction is between data and metadata. Here, the term “data” refers to the part of a file or dataset which contains the actual representation of an object of inquiry, while the term “metadata” refers to data about that data: metadata explicitly describes selected aspects of a dataset, such as the time of its creation, or the way it was collected, or what entity external to the dataset it is supposed to represent. Independently of its type, any dataset relevant to research represents specific aspects of the object of scrutiny, be it in the natural sciences, the social sciences, or the humanities. Data is not the object of study itself, but “stands in” for it in some way. Also, data is always a partial representation of the object of study. In some cases, however, it is our only window into the object of study. Still, this “disadvantage” of partial representation is small compared to the the fact that digital data can be transformed, analyzed, and acted upon computationally.
Data in the humanities is a bit special: one could in fact argue that text in a book or a manuscript, or the visual elements making up a painting, are data already. First, however, this is analog, non-discrete data, which cannot be analyzed or transformed computationally; and second, language, texts, paintings, and music are semiotic systems that have dimensions beyond the physically measurable, dimensions which depend on semantics and pragmatics, that is on meaning in context. For this latter reason particularly, speaking of “data” in the humanities is problematic and has been challenged. Criticism has come from mainstream scholars who see “data” and quantitative methods of analyzing them with suspicion, because the apparent empiricism of data-driven research in the humanities seems at odds with principles of humanistic inquiry, such as context-dependent interpretation and the inevitable “situated-ness” of the researchers and their aims.
Some practitioners of digital humanities, notably Joanna Drucker, have argued that the term “data” is actually inadequate. And indeed, the term’s etymology seems problematic in the context of the humanities: it comes from the Latin datum, which means “that which is given.” This means it carries with it the meaning of an observer-independent fact which cannot be challenged in itself. Johanna Drucker prefers to speak of “capta” instead of data, literally “that which has been captured or gathered”, underlining the idea that even the very act of capturing data in the first place is oriented by certain goals, done with specific instruments, and driven by a specific attention to a small part of what could have been captured given different goals and instruments. In other words, capturing data is not passively accepting what is given, but actively constructing what one is interested in.[6]
Similarly, Digital Archivist Trevor Owens has argued that data is not a given, but is always manufactured and created. Moreover, he shows, we can approach data from different perspectives and treat it as an artifact (something actively and purposefully created by people), as text (subject to interpretation, for example by scholars), and as computer-processable information (to be analysed with quantitative methods). According to Owens, this means that data is not a given and not some unquestionable evidence; rather, it is “a multifaceted object which can be mobilized as evidence in support of an argument.”[7]
Even without using a new term, we can now redefine what we mean by data in the humanities. Data in the humanities could be considered a digital, selectively constructed, machine-actionable abstraction representing some aspects of a given object of humanistic inquiry. Whether we are historians using texts or other cultural artifacts as windows into another time or another culture, or whether we are literary scholars using knowledge of other times and cultures in order to construct the meaning of texts, digital data add another layer of mediation into the equation. Data (as well as the tools with which we manipulate them) add complexity to the relation between researchers and their objects of study.
Basically, I would like to argue that there are two core types of data in the humanities: big data and smart data. These two types of data can be described in two dimensions: the first dimension describes how structured, clean, and explicit the data is; the second dimension describes how voluminous and how varied the data is. I suggest to view big data, in a first approximation, as relatively unstructured, messy and implicit, relatively large in volume, and varied in form. Conversely, I suggest to view smart data to be semi-structured or structured, clean and explicit, as well as relatively small in volume and of limited heterogeneity. Although you could say that these are really just differences of degree, there are more fundamental differences between them when it comes to looking at how each of them are created or captured, modeled, enriched, and analyzed.
2. Smart data (in the humanities)
When we move from books to digitized versions of the text contained in books, we are not necessarily dealing with big or smart data right away. It may very well be small and simple, not to say “messy” data in the beginning. This is probably the least useful type of data. So what do I mean by “smart data?”
First of all, I should mention that “smart data” is not an established or well-defined term. It is not very widespread and does not have a stable meaning. Smart data is data that is structured or semi-structured; it is explicit and enriched, because in addition to the raw data, it contains markup, annotations and metadata. And smart data is “clean”, in the sense that imperfections of the process of capture or creation have been reduced as much as possible, within the limits of the specific aspect of the original object being represented. This also means that smart data tends to be “small” in volume, because its creation involves human agency and demands time. The process of modeling the data is essential to small/smart data; its abstract structure can be defined with elaborate schemas or as predefined database structures.
A prototypical example of smart data are scholarly digital editions produced using the Guidelines[8] of the Text Encoding Initiative. Technically, TEI documents are usually considered semi-structured; usually, they follow a data model expressed in a schema, but such schemas allow for considerable flexibility. In addition to a very clean transcription of the text, digital editions using TEI can make a lot of information explicit: first of all, TEI files contain not just the full text, but also metadata associated with the text (in the teiHeader section); also, the data is structured and explicit: there is markup making the structure of the text explicit, identifying parts, chapters, headings, paragraphs, as well as page and line breaks, for example. Finally, many more types of information can be specified: for example person names in a novel or play, place names in a letters or documents, and many more things; and links to other parts of the documents and to external documents. Making all of these things explicit allows to visualize them in specific ways and to index, count and analyze them computationally.
But lets move on to another example of “smart data.” This data comes from a study of literary description in the eighteenth century novel which I conducted some years ago.[9] The aim was to identify all descriptive passages in a collection of thirty-two novels published between 1760 and 1800 and to find out how, from the standpoint of literary stylistics, descriptive writing “functioned” at that time. For this, a bibliographic reference management system was used as the front end to a database of descriptive passages which I collected and tagged for dozens of features I considered relevant for the study. For example, all 1,500 pieces of descriptive writing were tagged for the various textual strategies of integrating or legitimizing them in relation to the narrative context. This allowed me to discover previously unnoticed recurring configurations, patterns of usage, and trends over time. For example, although eighteenth-century novels do not “frame” descriptions as clearly and as symmetrically as some nineteenth-century novels do, most of the features of such framing are present. However, they are used in an asymmetrical way that tends to purposefully create a smooth transition between narration and description rather than a sharp framing contrast. In addition, correlations between such integrating strategies and different narrative perspectives were found, correlations which in turn help relate descriptive technique to long-term trends in French narrative fiction.
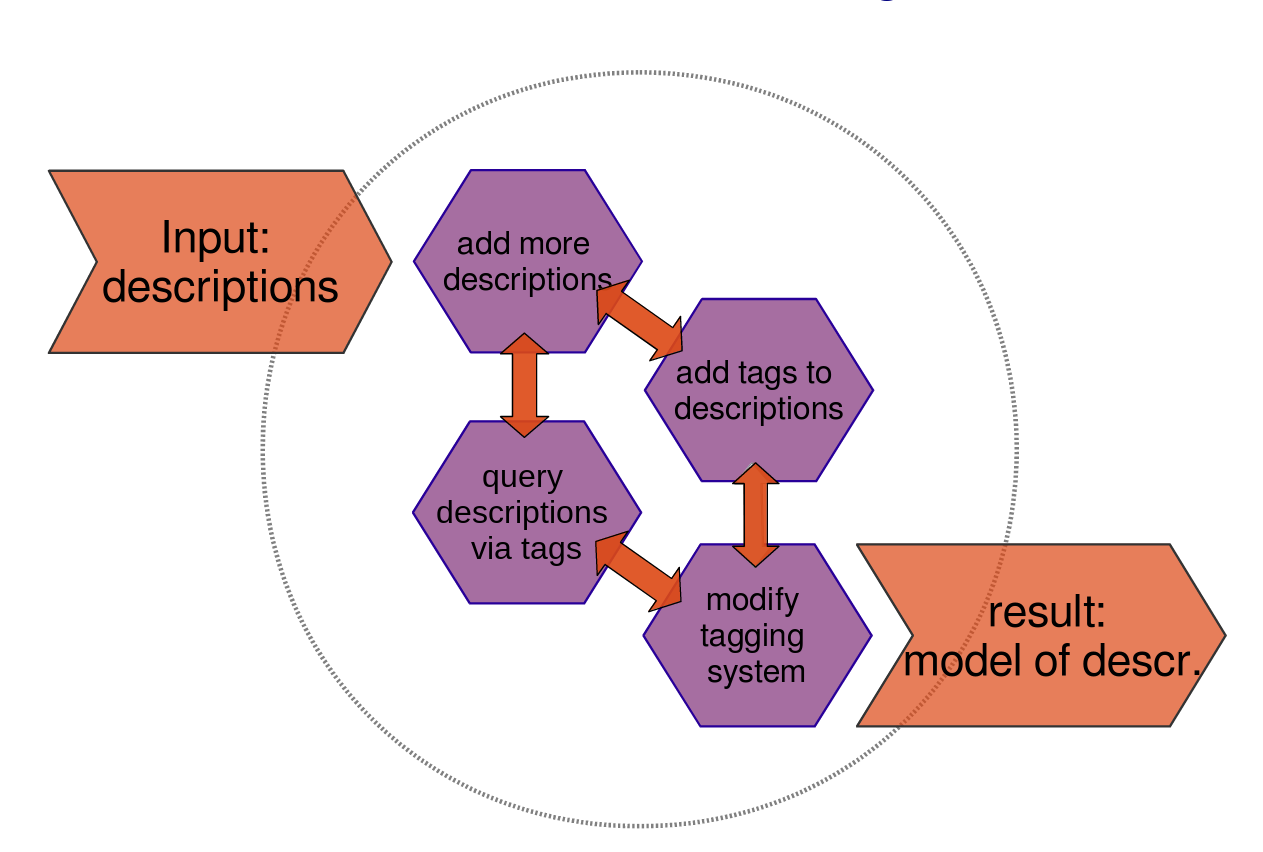
The iterative process of modeling descriptive techniques with keywords. Image published with a CC-BY license.
Using a database made it possible to deal with the 1,500 examples and their many tags. Also, having all excerpts and their tags at my fingertips changed the way I interacted with the data, as opposed to manual annotation and note-taking. Building the database itself was an ongoing process of explicit iterative modeling via an evolving set of tags and their relations, which involved adding more and more descriptions, adding tags to them, revising the tagging system and hence modifying the tags, etc. Recurring patterns and correlations could then be discovered; also, most importantly perhaps, outliers could not just be ignored and the resulting models attempt to cover not just a selection of examples judged to be representative but the full actual practice observed in the corpus.
Despite these significant transformations of the way we work with texts when they are available as “data,” I believe the move from print culture to smart digital data is actually a rather small step compared to the steps required by big data, a subject which will be addressed below. In the digital medium, we can also read texts, look at images, make annotations, and write down ideas and syntheses.
Now, this is all very well and good: smart data as we find it in scholarly digital editions, in annotated linguistic corpora and in carefully curated image collections is immensely useful. However, there is an issue with smart, clean data: it does not scale well. Although various aspects of creating smart data such as carefully encoded TEI documents can be at least partially automated, ultimately smart data depends on manual work by real people. Classifying descriptions in their context according to formal, semantic and narratologic categories is not something computers can do just yet. This means that it is very time-consuming to create large volumes of smart data.
Of course, there are ways to deal with this, and Machine Learning will no doubt be one of the keys to these challenges. But what if we actually don’t really need smart data? What if having a lot of relatively unstructured, relatively messy data is just as useful and much easier to create? This kind of data is called “big data,” so let’s have a closer look at this alternative model of data.
3. Big data (in the humanities)
Big data is the buzz-word of the decade. Everyone wants big data and big data technologies; big data experts are telling large corporations they won’t keep their competitive edge without big data. Areas as diverse as online marketing, stock exchange trading, health care, and political campaigns are driven by big data. The European Commission and the German Ministry of Education and Research hold “big data” conferences and fund big data research.
So, what does it mean for data to be “big”? Jonathan Ward and Adam Barker, the authors of a survey paper on definitions of big data, point out that because the term has been created and defined by industry, media and academia alike, there is a lack of common understanding regarding its definition. Their attempt to define such a common basis results in the following definition: “Big data is a term describing the storage and analysis of large and or complex data sets using a series of techniques including, but not limited to: NoSQL, MapReduce and machine learning.”[10] Definitions of big data can indeed vary widely depending on the perspective adopted. In a recent best-selling book about the Big Data Revolution, the authors propose a non-technical, outcome-oriented definition of big data: “Big data refers to things one can do at a large scale that cannot be done at a smaller one, to extract new insights or create new forms of value.”[11] Another high-profile albeit more technical definition of big data, by Doug Laney, points to three key qualities of such data, the three V’s: volume, velocity and variety.[12]
Although the three V’s seem to provide a more precise definition of big data, they also show that big data is in fact a relative term and a moving target, depending on context and available technologies. The idea that big data is defined by its (large) volume is seemingly the most obvious of the three V’s. However, when does a large volume of data really become “big data’? You may consider data you want to analyze to be big when it exceeds the memory of your computer, forcing you to move processing to a grid computing system. However, technologies enabling this are becoming more widespread: A solution like “Hadoop“, that allows the distributed but closely coordinated processing of huge volumes of data on hundreds or thousands of machines in a grid, is cutting-edge and fancy now, but will be mainstream very soon.
Second, the idea of “velocity” of data really means two things: first, that data is constantly being generated by sensors (in the natural sciences, or by public surveillance cameras) or as a by-product of people’s activities in a digital environment (in economics or the social sciences), creating a constant influx of new data. Second, this flow of data is being analyzed in real-time and has to be very quick and responsive. In turn, this allows to react immediately to the data. This aspect of big data is probably the least relevant to data in the humanities, at least today.
Finally, the idea of “variety” of big data means that heterogeneous sources and formats of data are being used together, taking advantage of the links and overlap between such heterogeneous datasets to allow all kinds of inferences. What the idea of “variety” also implies is a variety of ways these datasets are structured, or a relative lack of structure in the datasets. The challenges here lie particularly in the fact that all these various datasets cannot be integrated into one unified dataset. The heterogeneity is probably the biggest challenge of data in the humanities, which may come from a variety of sources, in a variety of formats, and need to be combined flexibly in order to take the greatest possible advantage from them. Similarly to grid computing, however, solutions like “NoSQL“-databases or graph-based databases that avoid some of the limitations that more traditional SQL-databases have when it comes to heterogeneous or unstructured data will soon be part of our normal data analysis toolbox and using them will not be an indicator of “big data” applications anymore.
In addition to this, big data in the humanities is not the same as big data in the natural sciences or in economics. In most cases, velocity does not play a key role in big humanities data right now. Also, the large “volume” is less usefully defined in the humanities by a shift from databases to distributed computing. Variety of formats, complexity or lack of structure does come into play, however. In fact, the distinctive mark of big data in the humanities seems to be a methodological shift rather than a primarily technological one. And it is a huge methodological shift. Paradoxically, the shift from small smart data to big data is much more radical, I would argue, than the shift from print to smart digital data was. Indeed, moving from smart data to big data implies a shift from “close reading” to “distant reading” (in the words of Franco Moretti) or to “macroanalysis” (to use Matthew Jockers’ term).[13] In this paradigm, instead of reading a few selected texts, we analyze an entire collection of relevant textual data.
The first consequence of the macroanalytic paradigm in the humanities, where hundreds or even thousands of texts are analyzed at a time, is that instead of operating on the level of literary forms and conventions, of semantics and context, we operate with quantitative measures of low-level features, on the basis of statistics and probabilities. The second consequence is that instead of so-called “representative” texts or paintings, we can now study the entire set of texts or images relevant to a specific research question. Trends in literature can be observed across the entire literary production of a given time and given genre. Questions of representativeness, of canonization, of literary quality play a much smaller, or at least a different, role in this context.
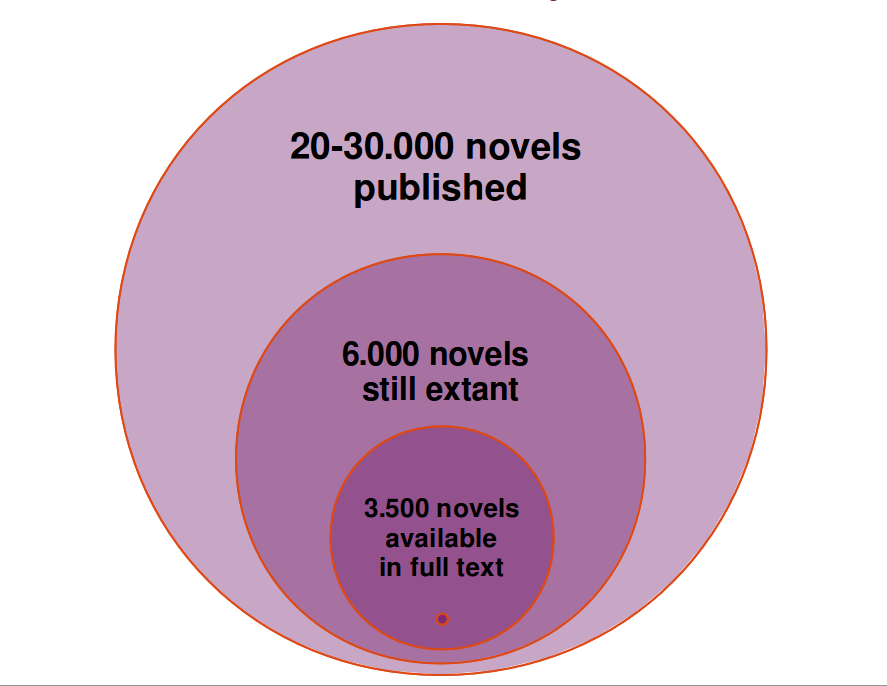
Digitization and availability of British Nineteenth-Century Novels. Image published under a CC-BY license.
If this sounds too good to be true, that is because it is. Despite massive digitization efforts by private and public actors, we are still far from the complete record of human culture and creativity, even if we are looking just at text. For the British nineteenth century novel, for example, the calculations go as follows: an estimated 20-30,000 novels were published in the nineteenth century; of these, only around 6,000 are estimated to be still existent in the holdings of libraries and private collections worldwide. Of these 6,000 novels only about half, that is 3,500 novels, have been digitized in full text mode and with sufficient metadata; this is the number of novels contained in the “Stanford Literary Lab Corpus” which Matthew Jockers used in some of the studies described in his book Macroanalysis. That corresponds to less than twenty percent of the total production.[14] This would certainly be a good sample size, if it were a random sample, but of course it is not. Rather, it is an opportunistic sample. So, the 3,500 novels seem like a small amount and not a number that actually resolves the sampling, representativeness, and canonization issues. Still, such a change of scale is a huge improvement over the mainstream canon which probably does not include more than one hundred novels for the nineteenth century, and may be visualized as a tiny spot at the bottom of the graph.
Such practical limitations in the digital materials available for research mean that examples for “really big” data in the humanities are still relatively rare. Even Google Books is not quite there yet. Google has scanned more than 30 million books, as of April 2013, and continues to scan more. Compared to the estimated 130 million books ever published, this is a large part of the written human record. But of course, this is neither exhaustive nor are books the only medium of print publication there is, so newspapers, magazines and journals would need to be added to this. What really counts, however, from my point of view, is less the volume than the methods used for analysis. And these can be successfully applied to smaller sets of data as well, and imply precisely the methodological paradigm shift I mentioned, from close to distant reading.
I would like to give just one example from my own work, dealing with French drama from the seventeenth and eighteenth century and involving a maximum of 580 individual plays. That’s not big data in the technical sense of the three V’s, but it requires a radical shift from close reading methods to quantitative, statistical analysis. The basic question I have been addressing for the last year or so is how traditional categories of literary history, such as literary genres, forms and periods, relate to classifications made on the basis of the actual linguistic material. What comes out of this type of analysis, which can be pushed further in a variety of ways, is that there are indeed correlations between linguistic features on the one hand, and large categories from literary history on the other hand; but also, that these are not simple and stable correlations, but highly complex and varying ones.
In one case, for example, I analysed a collection of French plays from the seventeenth century written by Thomas and Pierre Corneille using Principal Component Analysis, a technique which discovers correlations in multidimensional data and summarizes such correlations into so-called principal components.[15] The following graph shows how tragedies and comedies by these two authors cluster when plotting them according to the first two principal components.

Principal Component Analysis in Literary Studies: French plays by Thomas Corneille (TC) and Pierre Corneille (PC), some of the comedies (CO), some of them tragedies (TR). Image published under a CC-BY license.
Some interesting trends become visible: for example, it is remarkable how closely these two components seem to be related one to authorship and one to genre. Most plays in the left half are by Pierre Corneille, with some exceptions especially for the tragedies in the lower half. Most plays on the right side are by Thomas Corneille, again with some exceptions especially in the lower half. So the first component (horizontal axis) seems to be correlated with authorship. The second component (vertical axis), on the contrary, seems to be correlated with genre. Most plays in the upper half of the graph are comedies, and most plays in the lower half of the graph are tragedies. Only a few tragedies by Pierre Corneille and even less by Thomas Corneille appear in the upper half of the graph. Also, the dispersion of the data points (or plays) seems to be greater across PC1 for comedies than for tragedies. The tragedies are somewhat lumped together and authorship distinctions are actually hard to make just on the basis of PC1, so much overlap is there! This is not the case for the comedies in the upper half, where overlap seems to be much weaker. French tragedy as a genre, at least in the 1660s, seems to be more stylistically homogeneous than comedy, that is to be a particularly strongly conventionalized genre, a finding which is well-supported by mainstream scholarship.
Conclusion: towards smarter big data or bigger smart data
For most of this paper, I have been opposing big data and smart data. Indeed, big data tends to involve large volumes of raw, plain, somewhat messy text, whereas smart data tends to involve smaller volumes of carefully encoded, very clean text. Big data needs to be analyzed with methods from statistics, such as cluster analysis or principal component analysis and many more, whereas smart data can be analyzed with specific tools allowing to take advantage of structural, linguistic and contextual markup. Big data requires visualization to even start understanding its possible structure, whereas smart data makes its structures explicit. In big data applications, outliers, errors and ambiguities are said to matter little because they get smoothed over by the sheer quantity of information that is good enough, whereas smart data makes exceptions and ambiguities explicit and effectively reduces possible ambiguities.
That said, I believe the most interesting challenge for the next years when it comes to dealing with data in the humanities will be to actually transgress this opposition of smart and big data. What we need is bigger smart data or smarter big data, and to create and use it, we need to make use of new methods. So, how can we enrich big data sufficiently to make more intelligent queries possible? How can we speed up the process of creating smart data so that we can produce larger volumes of it?
Basically, there are two possible ways to do this: one is automatic annotation, the other is crowdsourcing. Automation refers to various heuristics of discovering implicit units, structures, patterns and relations, and of making them explicit in the data. Crowdsourcing, on the other hand, relies on breaking down a large task into such small units that each of these little tasks can be performed in a distributed way by a large number of volunteers. Various strategies have been developed for breaking up the tasks, for creating incentive structures to motivate volunteers (like “gamification” or “win-win”-constellations), and to reintegrate the added information into the project.
In fact, automation and crowdsourcing will have to work hand in hand. This is what happens with OCR: better and better optical character recognition systems are still no match to manual double-keying or transcription by experts, especially when it comes to print before 1800 or to handwriting. But state-of-the art OCR combined with algorithms to detect potential areas of error and cleverly crowdsourced and distributed error-correction mechanisms such as the ones implemented by “Captcha” go a long way to producing large amounts of more reliable full text. Similarly, automatic linguistic annotation even of basic linguistic features for well-researched languages is still too faulty to be trusted blindly, at least in a “clean smart data” perspective. We will have to find ways of detecting potentially faulty linguistic annotation, then finding and motivating users to check such annotations, and writing the corrections back into larger and larger collections of clean, structured and well-annotated text.
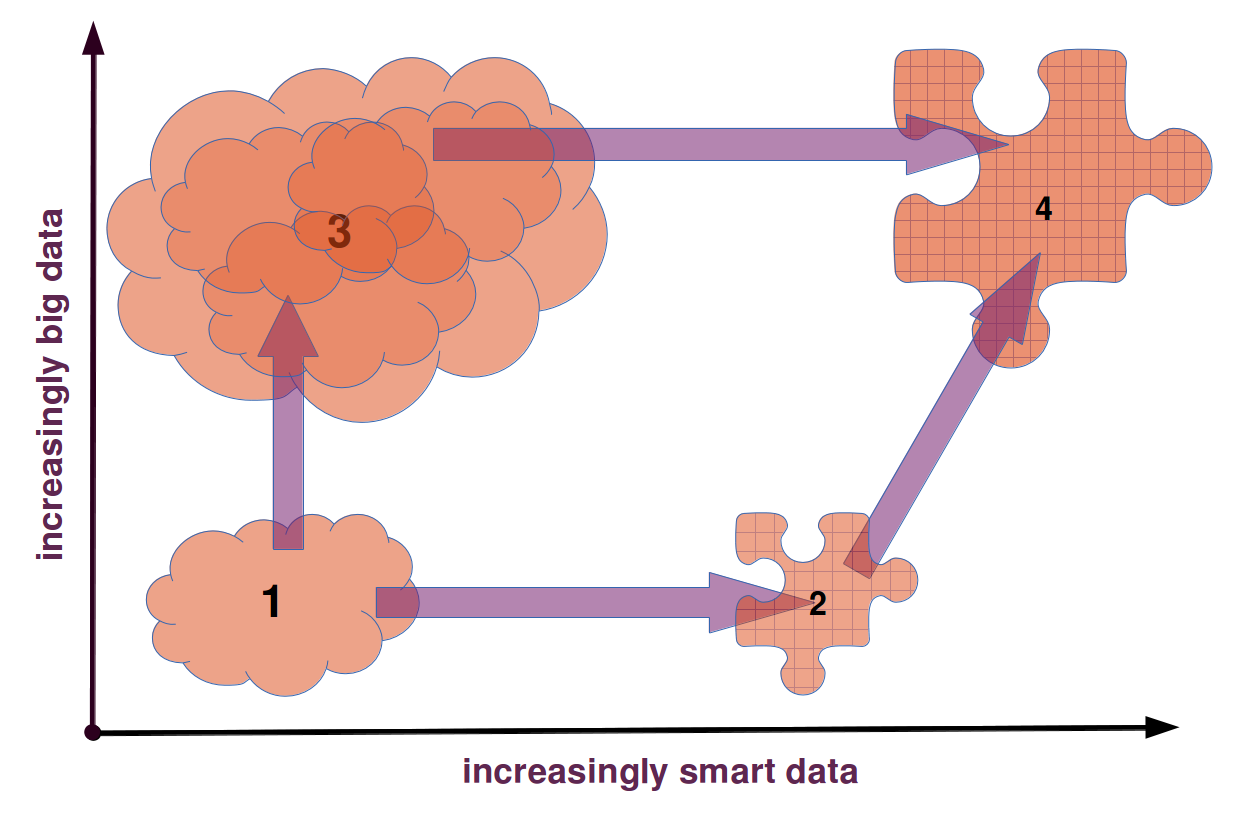
The story of smart and big data.
To summarize the story of data in the humanities which I have been trying to tell, one could consider that this story has several steps: The first step leads from the study of creative works in the form of books, paintings and movies to their study based on digital representations of these works; this is what digitization at its most basic level as brought about; the first of two possible steps from there leads to smart data, that is to data that has been carefully curated, structured, annotated in a way to make explicit a lot of information that is implicit in the “raw” and messy digitized artifacts. This happens, prototypically, in scholarly digital editions of text or music scores. The second of the two possible steps from “raw digital data” leads to big data, simply by accumulating more and more data and letting the algorithms sort it all out, instead of cleaning it up by hand. The last step in this story is to reconcile, or rather to combine, the smart and the big data approaches.
For my own research in computational genre stylistics, having collections of texts at my disposal that are both larger and smarter than what we have now will be crucial. Collections need to be large, because as soon as you focus on more specific cases, such as a specific sub-genre from a specific period, even a relatively large collection of texts will only yield a small number of samples. And when the number of samples gets too low, statistical approaches loose their robustness and reliability. And similarly, more nuanced and interesting analyses of large text collections depend on having a large array of metadata and annotations regarding each text, including things like the proportion of verse and prose in a play, or of description and narration in a novel. Such information needs to be available so that correlations between stylometric findings concerning a text and relevant attributes of the text in question, can be discovered.
In other words, we need smart big data because it can not only adequately represent a sufficient number of relevant features of humanistic objects of inquiry to enable the level of precision and nuance scholars in the humanities need, but it can also provide us with a sufficient amount of data to enable quantitative methods of inquiry that help us transgress the limitations inherent in methods based on close reading strategies. To put it in a nutshell: only smart big data enables intelligent quantitative methods.
Originally published by Christof Schöch on August 1, 2013 and revised for the Journal of Digital Humanities in November 2013.
- [1] This contribution is a revised version of a talk I gave at the European Summer University “Culture & Technology” organized by Elisabeth Burr at the University of Leipzig in Germany, on July 26, 2013. The Summer University brings together graduate students and researchers from a wide range of disciplines in the humanities and in computer science from many different countries around the world. The talk was one of several plenary talks intended to introduce the audience to various topics of more general concern, in addition to the more specific workshop tracks. The talk was the result of a cooperation between the European Summer University and the German branch of the DARIAH initiative in which I am a research associate and where I am mostly concerned with understanding digital methods and with supporting and training mainstream humanities scholars to use such methods. A slightly revised version of the talk was documented on my blog, The Dragonfly’s Gaze, in early August 2013. The research reported here has been supported by DARIAH-DE with funding provided by the German Federal Ministry of Education and Research (BMBF) under the identifier 01UG1110A-M.↩
- [2] There are many such sources of digital data for research in the humanities: we have large text archives such as Google Books, Hathi Trust, the Internet Archive, or Gallica; we have scholarly digital text archives such as TextGrid’s Digital Library of German-language literature from 1500 to 1900 or the Théâtre Classique collection of French Drama, and many others; and we have hundreds of elaborate digital editions of literary and historical texts, such as the Van Gogh Letters, the Walt Whitman archives, or Rousseau-Online. We have image databases like “Flickr Commons,” the distributed image archive Prometheus, Getty, and others. And we have sites like Youtube, Open Culture and the Moving Image Archive.↩
- [3]See Christine Borgman: Scholarship in the Digital Age: Information, Infrastructure, and the Internet. Cambridge & London: MIT Press, 2010. Also, see her article “The Digital Future Is Now: A Call to Action for the Humanities.” Digital Humanities Quarterly 3.4, 2009, §1-82. http://digitalhumanities.org/dhq/vol/3/4/000077/000077.html%20/000077.html↩
- [4]Luciano Floridi: Information. A Very Short Introduction. Oxford: Oxford Univ. Press, 2010, 22-25.↩
- [5]See Dinesh P. Mehta and Sartaj Sahni (eds.): Handbook of Data Structures and Applications. Boca Raton: Chapman & Hall/CRC, 2005, section “Basic Structures.”↩
- [6]Joanna Drucker: “Humanities Approaches to Graphical Display”, DHQ: Digital Humanities Quarterly 5.1, 2011. http://www.digitalhumanities.org/dhq/vol/5/1/000091/000091.html.↩
- [7]Trevor Owens: “Defining Data for Humanists: Text, Artifact, Information or Evidence?”, Journal of Digital Humanities 1.1, 2011, http://journalofdigitalhumanities.org/1-1/defining-data-for-humanists-by-trevor-owens/, §2.↩
- [8]Lou Burnard and Syd Bauman (eds.): TEI P5: Guidelines for Electronic Text Encoding and Interchange. Version 2.5.0. Charlottesville, VA: Text Encoding Initiative Consortium, 2013. http://www.tei-c.org/Vault/P5/2.5.0/doc/tei-p5-doc/en/html/↩
- [9]This study was done as part of my doctoral dissertation; its results have been published as Christof Schöch: La Description double dans le roman français des Lumières 1760-1800. Paris: Classiques Garnier, 2011.↩
- [10]Jonathan Stuart Ward and Adam Barker: “Undefined By Data: A Survey of Big Data Definitions”. ArXiv e-print, September 20, 2013, http://arxiv.org/abs/1309.5821.↩
- [11]Viktor Mayer-Schönberger and Kenneth Cukier: Big Data: a Revolution That Will Transform How We Live, Work, and Think. Boston: Houghton Mifflin Harcourt, 2013, 6.↩
- [12]Doug Laney, “3D-Data Management: Controlling Data: Volume, Velocity and Variety”, 2001; republished at: http://blogs.gartner.com/doug-laney/files/2012/01/ad949-3D-Data-Management-Controlling-Data-Volume-Velocity-and-Variety.pdf.↩
- [13]For analyses conducted within this paradigm, see Franco Moretti: Graphs, Maps, Trees: Abstract Models for a Literary History. London: Verso, 2005 (a recent volume of collected papers by Moretti is: Distant Reading. London: Verso, 2013.) For a broad introduction to the field of quantitative literary studies, see Matthew L. Jockers, Macroanalysis: Digital Methods and Literary History. Urbana: Univ. of Illinois Press, 2013.↩
- [14]Numbers reported in Matthew Jockers: Macroanalysis. Digital Methods and Literary History. Urbana: Univ. of Illinois Press, 2013, 19.↩
- [15]For more details on this and related analyses, see: Christof Schöch: “Principal Component Analysis for Literary Genre Stylistics”, The Dragonfly’s Gaze, September 29, 2013, http://dragonfly.hypotheses.org/472. See also: Christof Schöch,”Fine-Tuning our Stylometric Tools: Investigating Authorship and Genre in French Classical Drama”. Digital Humanities Conference 2013, University of Nebraska-Lincoln, 15.-19.7.2013, http://dh2013.unl.edu/abstracts/ab-270.html.↩