Visual Historiography: Visualizing “The Literature of a Field”
David J. Staley, Scot A. French and Bill Ferster
Poster

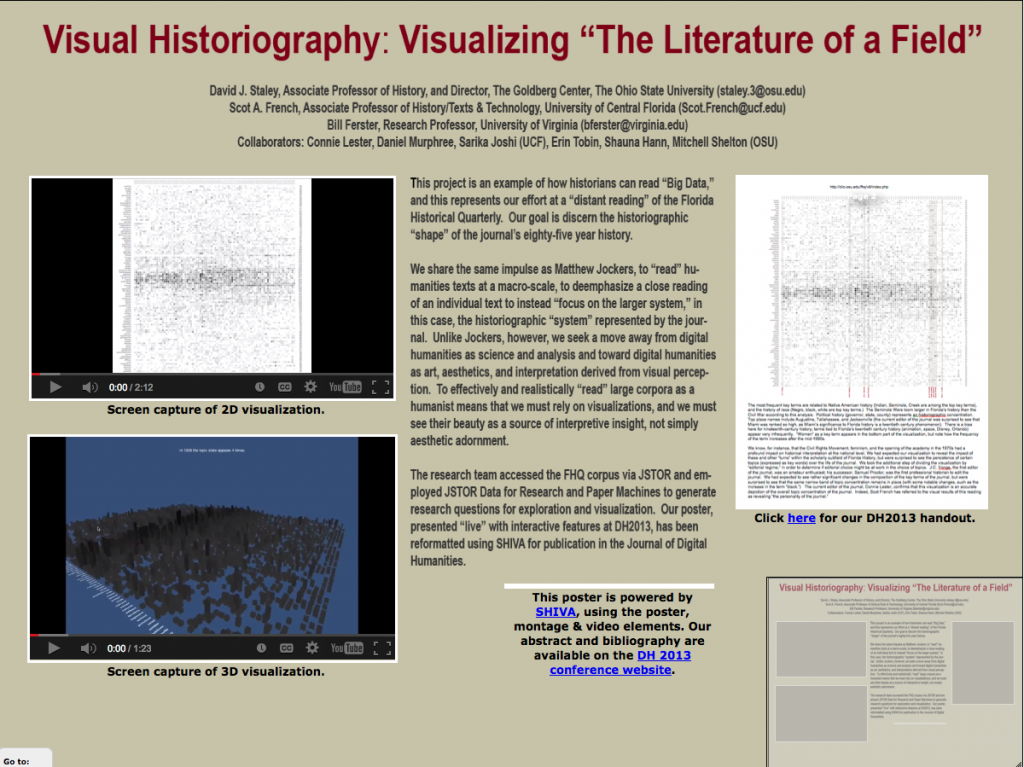
Click here or on the image to visit the interactive poster.
Abstract
The call for visualizing “Big Data” has generated a groundswell of interest among historians and humanities scholars, as demonstrated by the international response to the National Endowment for the Humanities’ 2010 and 2011 Digging into Data challenges (Williford and Henry, 2012). Exemplary efforts from the first two rounds of projects, such as Stanford University’s “Mapping the Republic of Letters,” and the University of Nebraska at Lincoln’s “Railroads and the Making of Modern America,” suggest the great potential for visualizing large repositories of primary sources for historical insight.
Our project treats the published work of historians in a peer-reviewed scholarly journal — Florida Historical Quarterly, housed at the University of Central Florida and accessible in digital form through J-STOR — as a primary source dataset to be analyzed and visualized. In applying macro-level reading and text-mining tools to the secondary literature of a scholarly field (History) and its subfields (American History/Florida History), we propose to make “visible” patterns of topical “coverage,” changing conceptual/analytical/theoretical frames of reference, and patterns of scholarly influence. We know, for instance, that the Civil Rights Movement, feminism, and the opening of the academy in the 1970s had a profound impact on historical interpretation at the national level (Novick 1988). We expect our data visualization of FHQ journal articles to reveal the impact of these and other “turns” within the scholarly subfield of Florida History, both confirming and perhaps challenging assumptions based on more traditional reading practices.
“Knowledge mapping” is more commonplace in the sciences than in the humanities. Chaomei Chen asks, “Why do scientists not have a viewfinder to their own fields? Why cannot scientists videotape the evolution of their own fields, their paradigm shifts, the rises of their own stars and the expansion of their own galaxies of intellectual contributions? … How can we visualize the process of a paradigm shift?” (Chen 2006) We ask the same questions about history: can we use the tools of knowledge domain visualization to map out shifting paradigms and historiographic “turns” in history? What happens when we apply the techniques of “distant reading” (Moretti 2005) and human-assisted “machine reading” (Hayles 2012) to the secondary literature in history? What insights might visualization of the data produce for historiography? (Staley 2003) Our reading of the literature at this scale forces us to rethink our assumptions about how we understand “seminal” articles/works. More importantly, new questions emerge when we “read” the secondary literature of a field at this macro scale, such as determining the influence of journal editors on the topical/historiographic orientation of the journal.
This poster will present the results of our case study, which examines an 85-year run of the Florida Historical Quarterly, (1924-2009) made accessible and searchable via Data For Research J-STOR. We will display our findings through interactive visualizations generated in consultation with Ohio State and UCF graduate researchers, FHQ editorial staff, and visualization specialist Bill Ferster (Ferster, 2012) at the University of Virginia. Visual patterns, the result of a reading of a large textual corpus at a distance, can in and of themselves result in interpretive insights. Stephen Ramsay’s “algorithmic criticism” (criticism derived from algorithmic manipulations of text) relies on the generation of visual patterns as the product of these computer-enabled interpretive acts (Ramsay 2011). Rather than being an intermediate step toward a written piece of scholarship — the preferred approach of humanists — the visualization itself becomes the hermeneutical/scholarly performance, the visualization is the hermeneutic object. Such a practice asserts “the primacy of pattern as the basic hermeneutical function [which would unite] art, science, and criticism.” Our poster visualizes the “primacy of topical/historiographic patterns” in the Florida Historical Quarterly.
Our poster will outline our research methodology — a hybrid of qualitative and quantitative analysis, enabled by human-assisted machine-reading. We extend David Mimno’s “computational historiography” (Mimno 2012) beyond a two-topic, p- or not-p approach to topic modeling. For analytic purposes, we will compare the results of our human-assisted “distant reading” with the perceptions of editors about how the field of Florida history, in its discourse with history in general, has changed over time. We will also problematize these results, pointing to the potential “false positives” that can result from such machine reading and visualization. We will explore the relationship of necessity between machine-and human-reading.
This poster was originally presented at DH2013 on July 17, 2013.
References
Williford, C. and C. Henry (2012). One Culture: Computationally Intensive Research in the Humanities and Social Sciences: A Report on the First Respondents to the Digging into Data Challenges. Washington, D.C.: Council on Library and Information Resources.
Mimno, D. (2012). Computational Historiography: Data Mining in a Century of Classics Journals. Journal on Computing and Cultural Heritage, 5(1):1-19.
Hayles, N. K. (2012). How We Think: Digital Media and Contemporary Technogenesis. Chicago: University of Chicago Press.
Ferster, B. (2012) Interactive Visualization: Insight Through Inquiry. Boston: MIT Press.
Ramsay, S. (2011). Reading Machines: Toward an Algorithmic Criticism. Champaign, Il.: University of Illinois Press.
Chen, C. (2006). Information Visualization: Beyond the Horizon. New York: Springer.
Staley, D. (2003). Computers, Visualization and History: How New Technology Will Transform Our Understanding of the Past. Armonk, N.Y.: M.E. Sharpe.
Novick, P. (1988). That Noble Dream: The ‘Objectivity Question’ and the American Historical Profession. Cambridge: Cambridge University Press.
